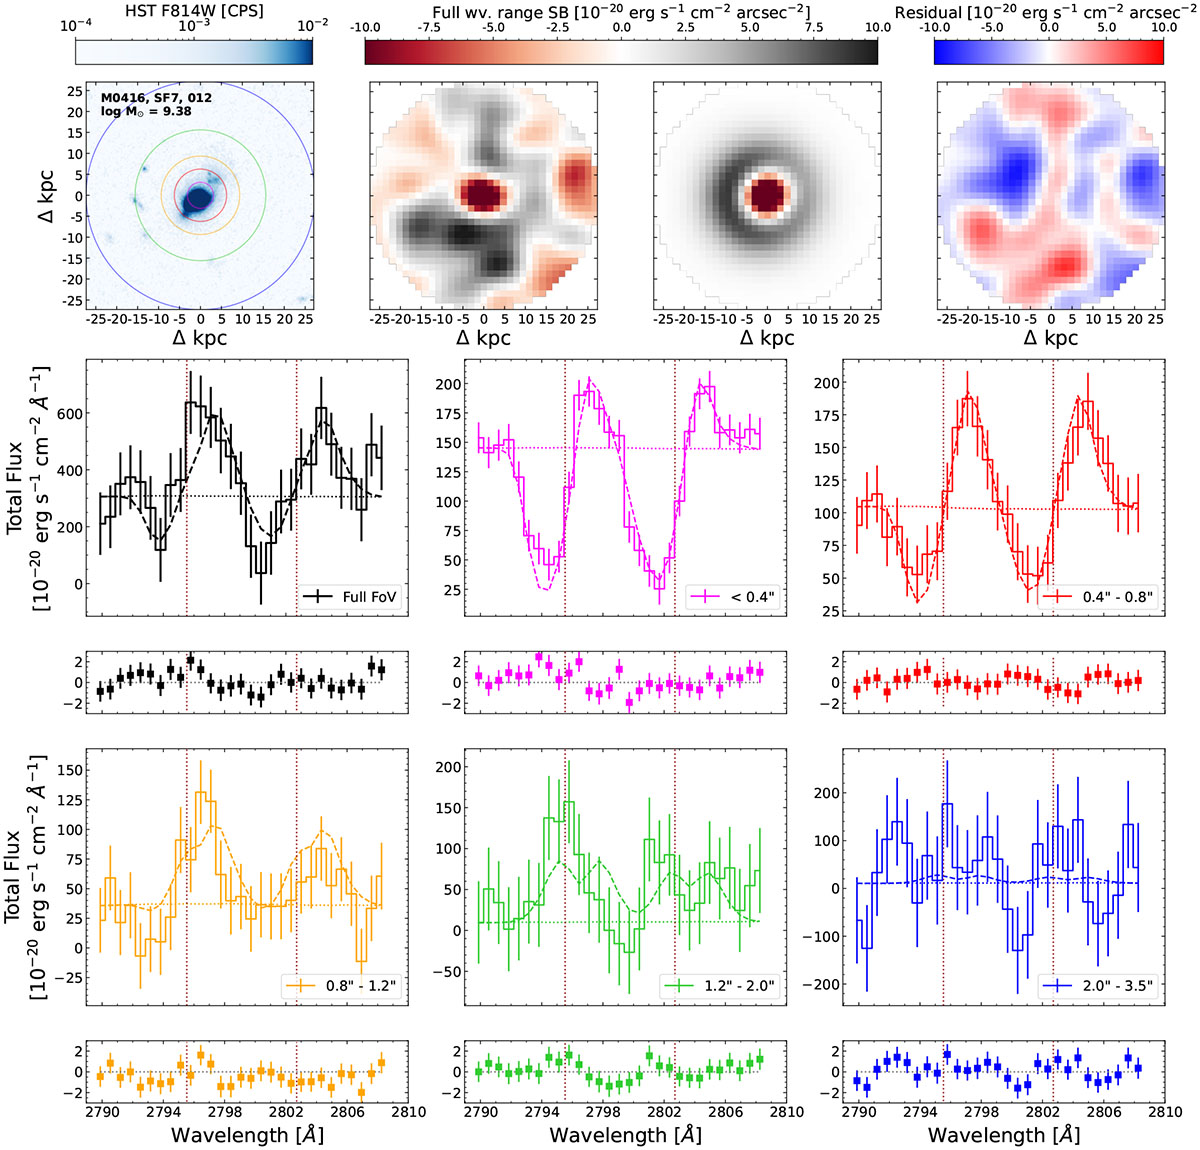
Fig. 8.
Download original image
Summary of the comparison of the observed and best-fitting model Mg II spectral profile and continuum-subtracted pseudo-narrowband images for an example galaxy in our final sample (M0416-SF7-012). The top-left panel shows the cutout of the HST F814W image around the galaxy, of 7 arcsec2 size. The top-middle panels show the observed (middle-left) and best-fitting model (middle-right) continuum-subtracted Mg II pseudo-narrowband images. The pseudo-narrowband images were created by collapsing the cubes across the wavelength axis, for wavelengths that enclose the full P-Cygni profile of the Mg II doublet. The size of the pseudo-narrowband images is the same as that of the HST F814W cutout. The two panels show net Mg II emission in black and net Mg II absorption in red. The residuals between both images are shown in the top-right panel. The rest of the panels show the integrated Mg II spectra on different annular (and circular) apertures for the data (solid) and best-fitting model (dashed) cubes. The residuals are shown in the small panels below, in units of standard deviations. The vertical dotted brown lines indicate the rest-frame wavelength of the Mg II doublet. The blue circle in the top-left panel shows the size of the full modeled region, and the black spectrum corresponds to the spectrum integrated over it. The rest of the panels that show colored spectra (and residuals) correspond to the comparison of the spectra extracted from the data and model cubes, in different annular and circular (in the case of the magenta spectra) apertures. In the legend of each panel, the inner and outer radii of the annular apertures are indicated. The color of the spectra in each panel matches the color of the circle in the top-left panel, which corresponds to the outer radii of its annular (or circular) aperture. The nearly horizontal dotted lines in each panel indicate the approximate continuum level.
Current usage metrics show cumulative count of Article Views (full-text article views including HTML views, PDF and ePub downloads, according to the available data) and Abstracts Views on Vision4Press platform.
Data correspond to usage on the plateform after 2015. The current usage metrics is available 48-96 hours after online publication and is updated daily on week days.
Initial download of the metrics may take a while.