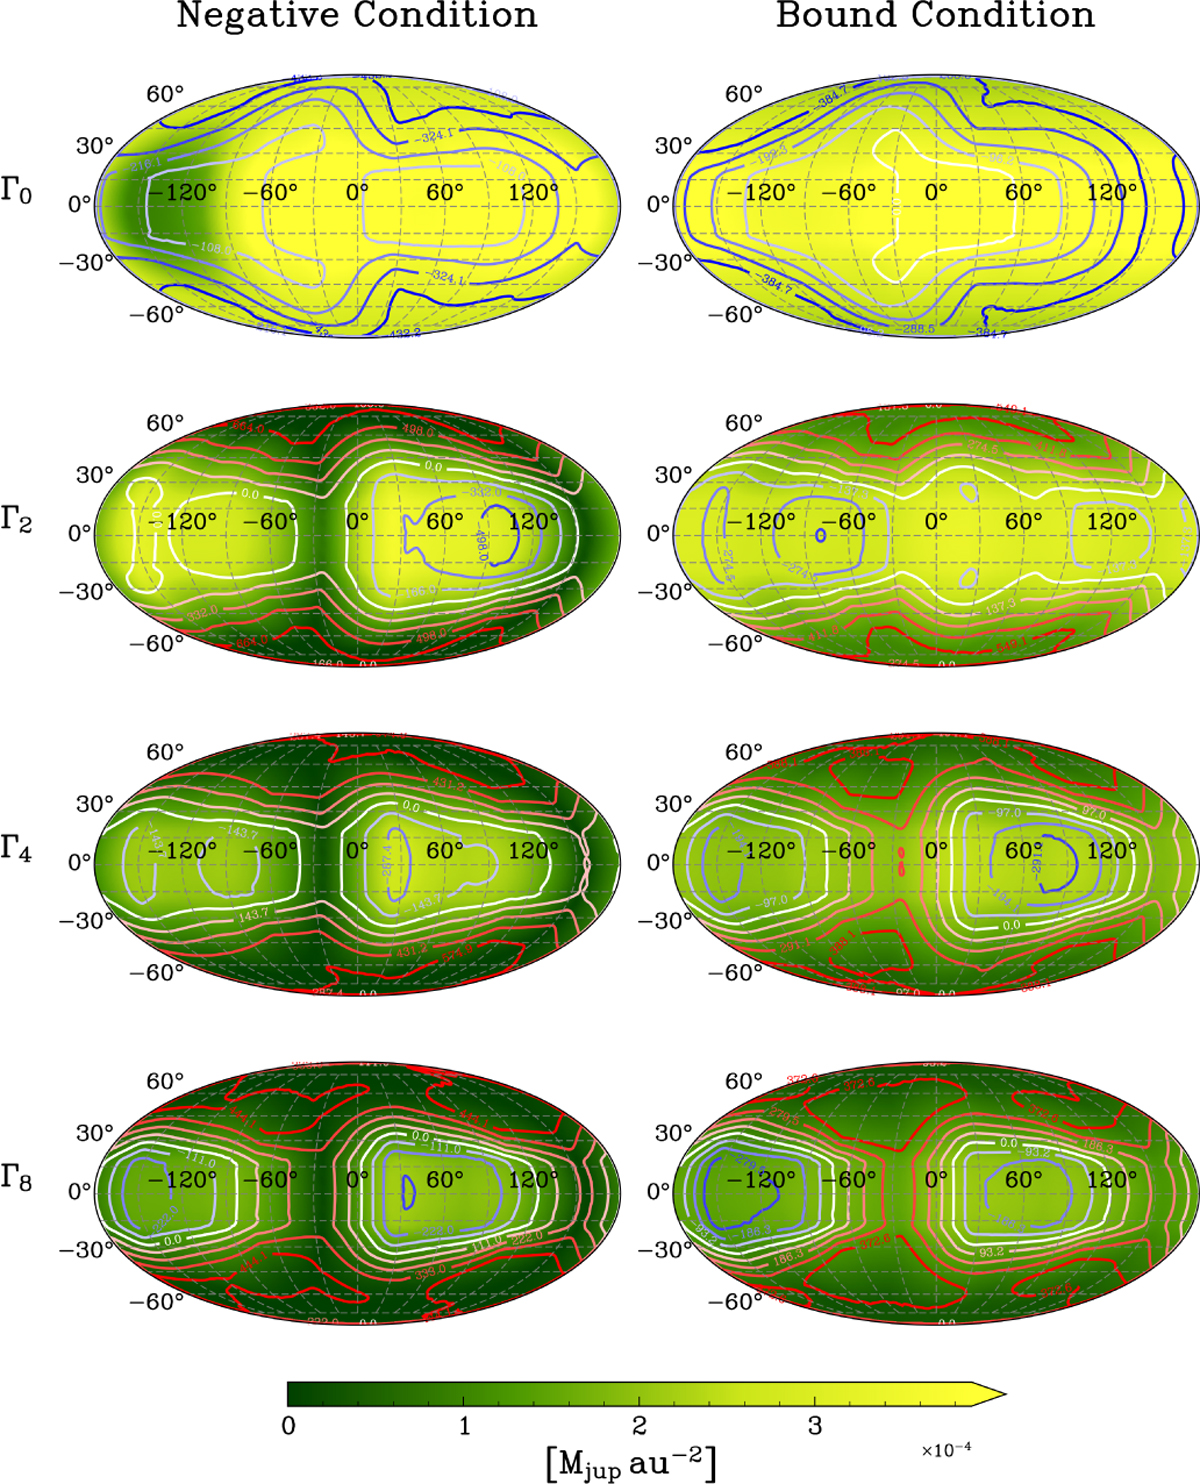
Fig. C.1
Download original image
Radial slice of the accreted mass surface density at 50 orbits for κ = 5. Rows correspond to the models Γ0, Γ2, Γ4, and Γ8 from top to bottom. Left column: Simulations employing the negative radial velocity condition. Right column: Simulations using the bound material condition. The maps are extracted on a spherical shell at R = 0.15 rH. The color scale indicates the accreted mass per unit area in units of Mjup au−2. Overlaid contours show the mass flux, with signs defined according to Eq. (21).
Current usage metrics show cumulative count of Article Views (full-text article views including HTML views, PDF and ePub downloads, according to the available data) and Abstracts Views on Vision4Press platform.
Data correspond to usage on the plateform after 2015. The current usage metrics is available 48-96 hours after online publication and is updated daily on week days.
Initial download of the metrics may take a while.