Fig. 4
Download original image
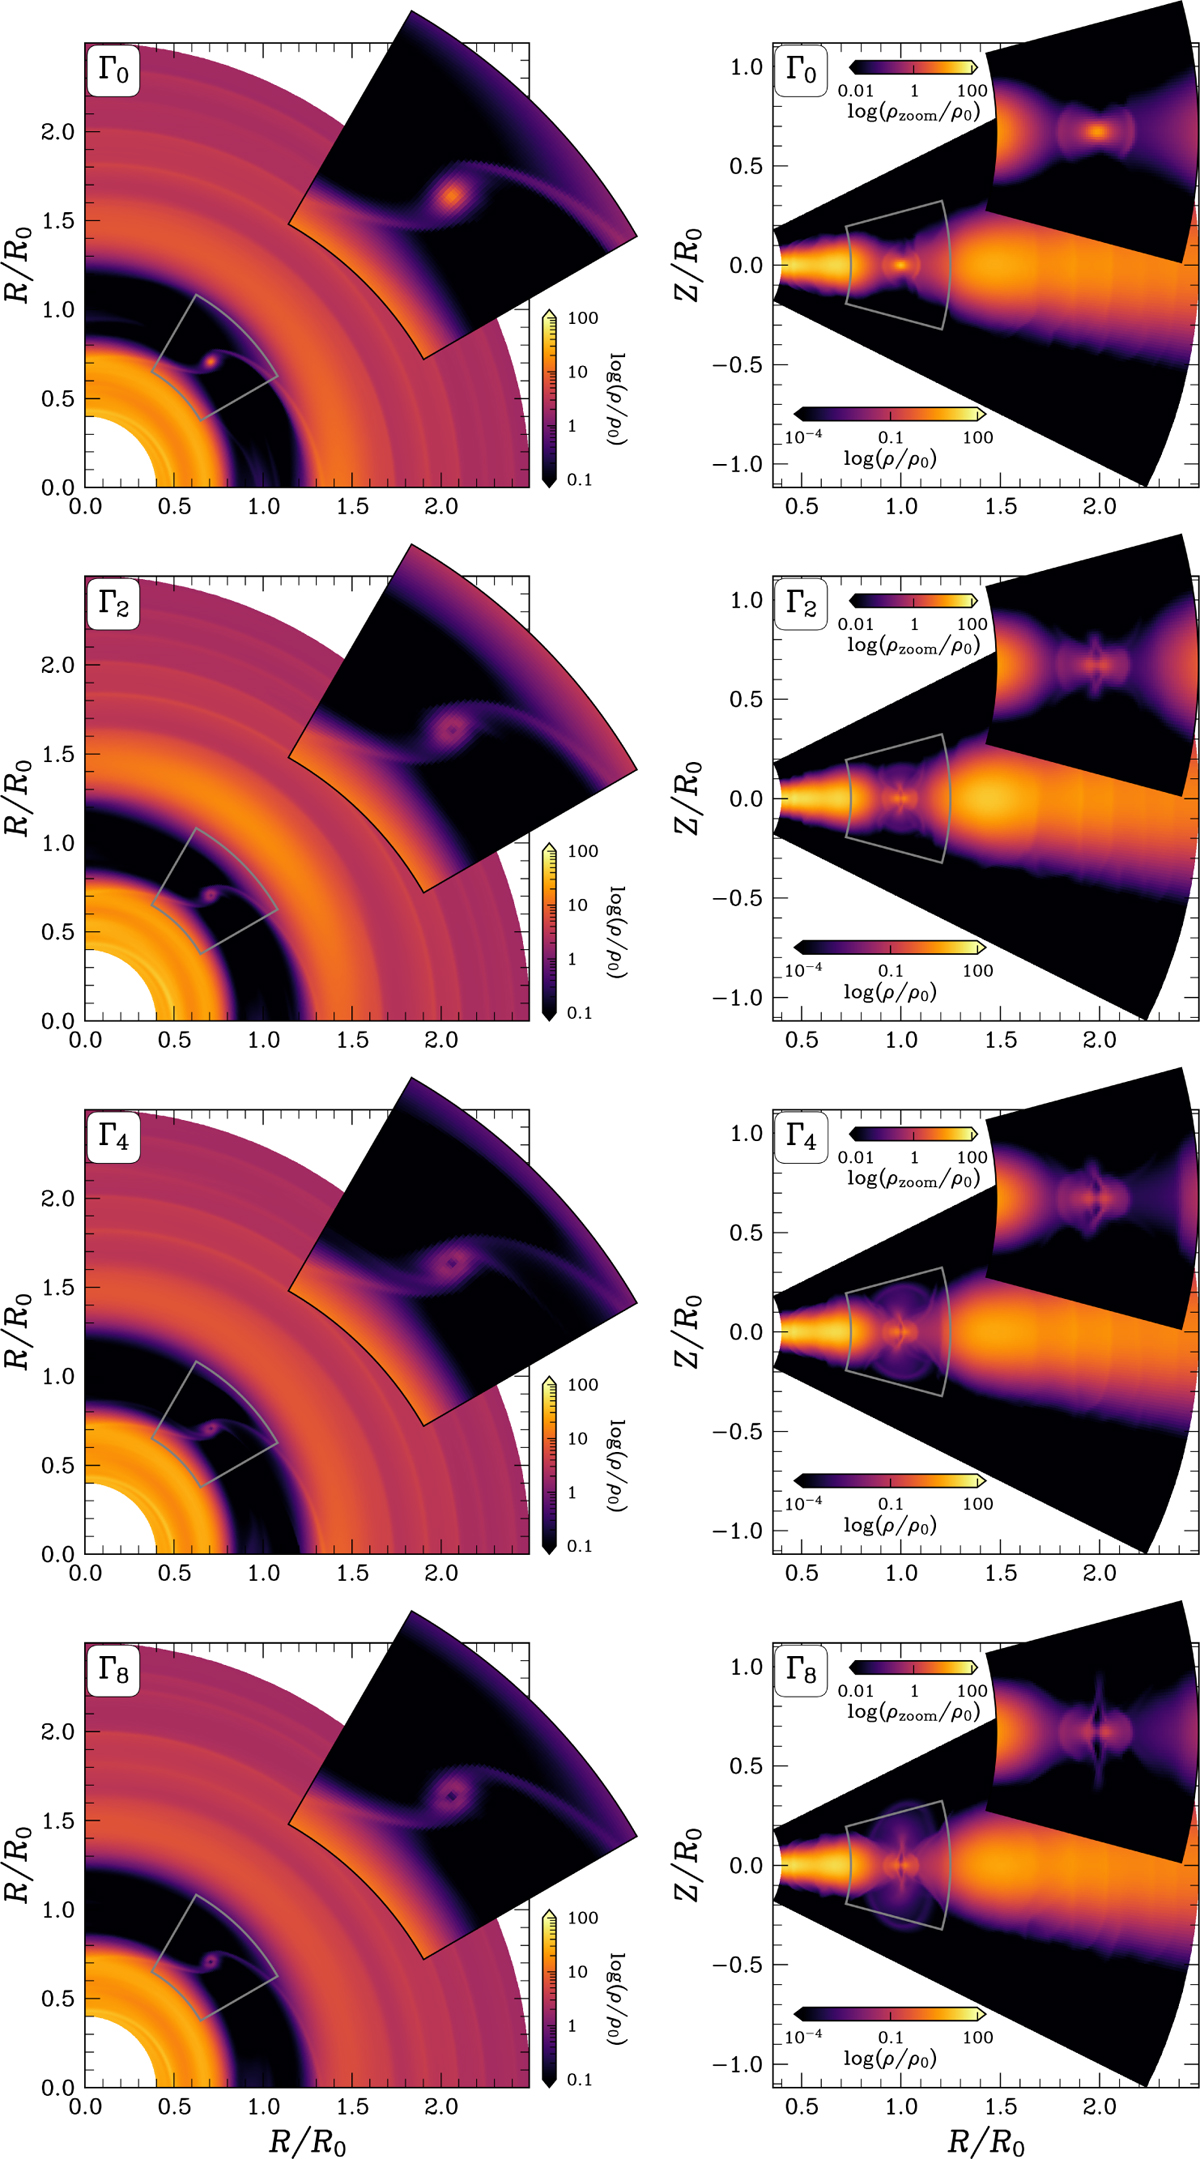
Comparative snapshots of simulations Γ0, Γ2, Γ4, and Γ8 (from top to bottom). All snapshots were taken at 500 planetary orbits. Left column panels: logarithmic gas density in the disk midplane (R-ϕ) with a zoomed-in view centered on the planet. Right column panels: meridional slices (R–Z) of the logarithmic gas density. Panels in the left and right columns use the same color scale except for the full disk view and the zoomed-in region, which use different color scales, with the latter denoted by ρzoom to highlight both global and local density structures.
Current usage metrics show cumulative count of Article Views (full-text article views including HTML views, PDF and ePub downloads, according to the available data) and Abstracts Views on Vision4Press platform.
Data correspond to usage on the plateform after 2015. The current usage metrics is available 48-96 hours after online publication and is updated daily on week days.
Initial download of the metrics may take a while.