Fig. 5
Download original image
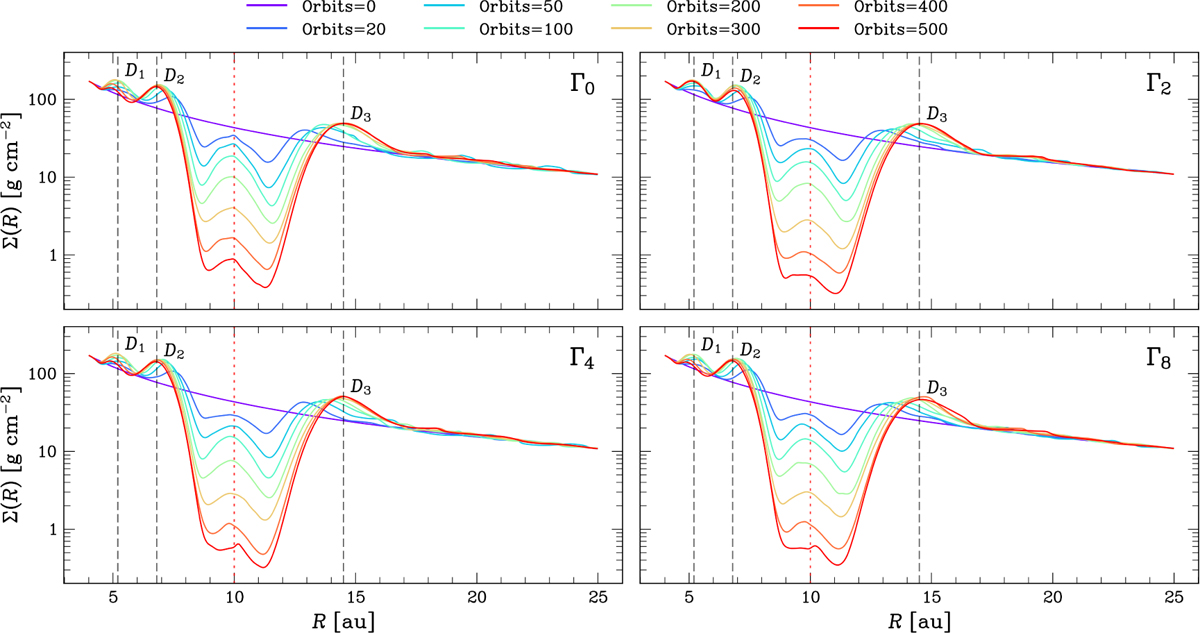
Surface density profile evolution for Γ0 (top-left), Γ2 (top-right), Γ4 (bottom-left), and Γ8 (bottom-right). The planet’s position at 10 au is marked by a dashed red line. The planet opens a primary gap and excites three overdensities (D1, D2, D3). Surface density profiles are obtained by integrating the volumetric density over the polar angle (θ) and then averaging over the azimuthal angle (ϕ) for each orbit.
Current usage metrics show cumulative count of Article Views (full-text article views including HTML views, PDF and ePub downloads, according to the available data) and Abstracts Views on Vision4Press platform.
Data correspond to usage on the plateform after 2015. The current usage metrics is available 48-96 hours after online publication and is updated daily on week days.
Initial download of the metrics may take a while.