Fig. 3
Download original image
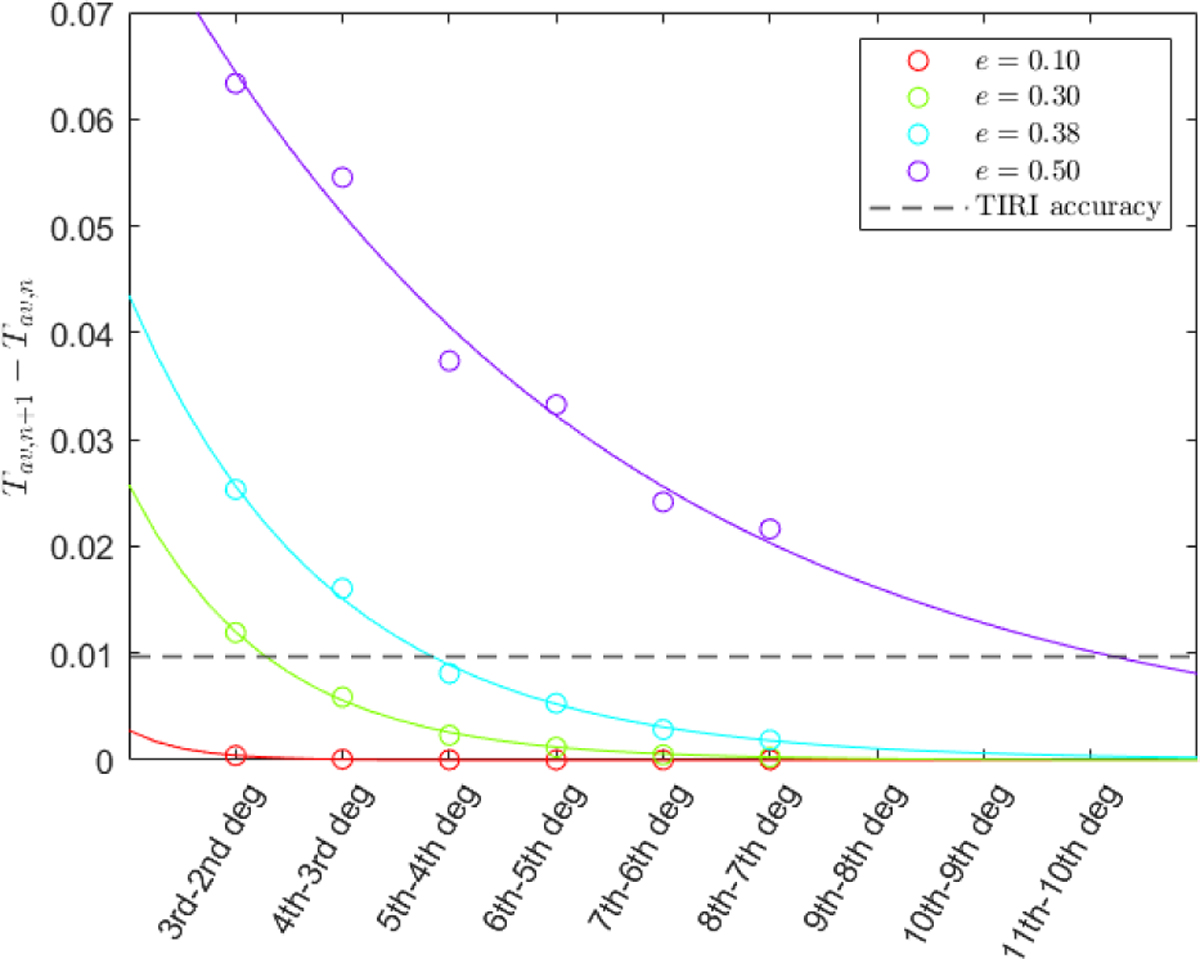
Differences between consecutive degrees of approximation for four different values of e. The dashed line represents the accuracy of TIRI, and the solid lines are obtained through exponential fits that can be used to extrapolate an estimate of the required truncation degree for which the differences fall below the accuracy threshold.
Current usage metrics show cumulative count of Article Views (full-text article views including HTML views, PDF and ePub downloads, according to the available data) and Abstracts Views on Vision4Press platform.
Data correspond to usage on the plateform after 2015. The current usage metrics is available 48-96 hours after online publication and is updated daily on week days.
Initial download of the metrics may take a while.