Fig. 7
Download original image
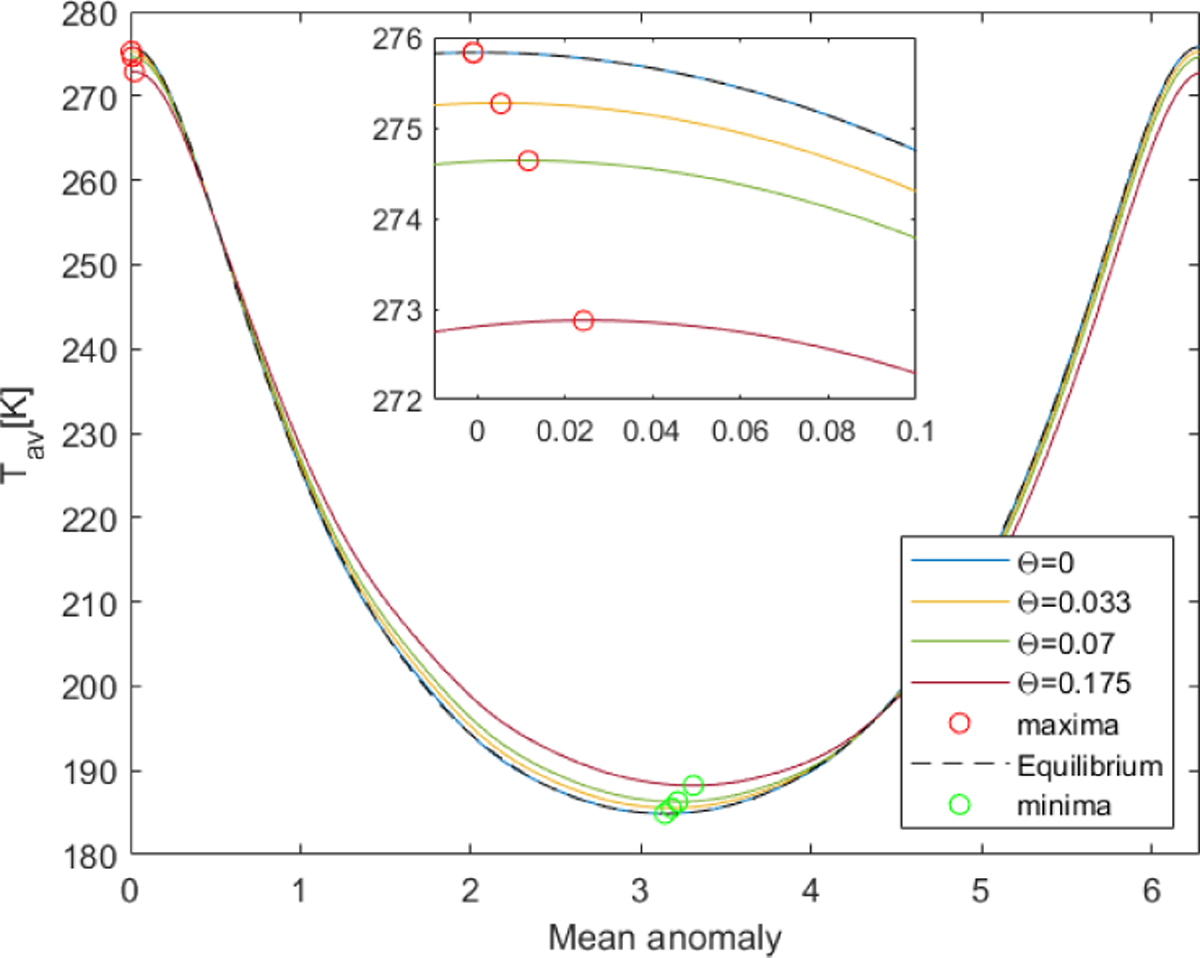
Degree 8 mean temperature profiles for e = 0.38 and varied values of Θ (solid lines). The open circles indicate maxima (red) and minima (green) of Tav. The nested plot shows a zoom of the post-perihelion temperature profile. The higher Θ values result in a smaller difference between maximum and minimum Tav and a longer post-perihelion and -aphelion lag.
Current usage metrics show cumulative count of Article Views (full-text article views including HTML views, PDF and ePub downloads, according to the available data) and Abstracts Views on Vision4Press platform.
Data correspond to usage on the plateform after 2015. The current usage metrics is available 48-96 hours after online publication and is updated daily on week days.
Initial download of the metrics may take a while.