Fig. 1.
Download original image
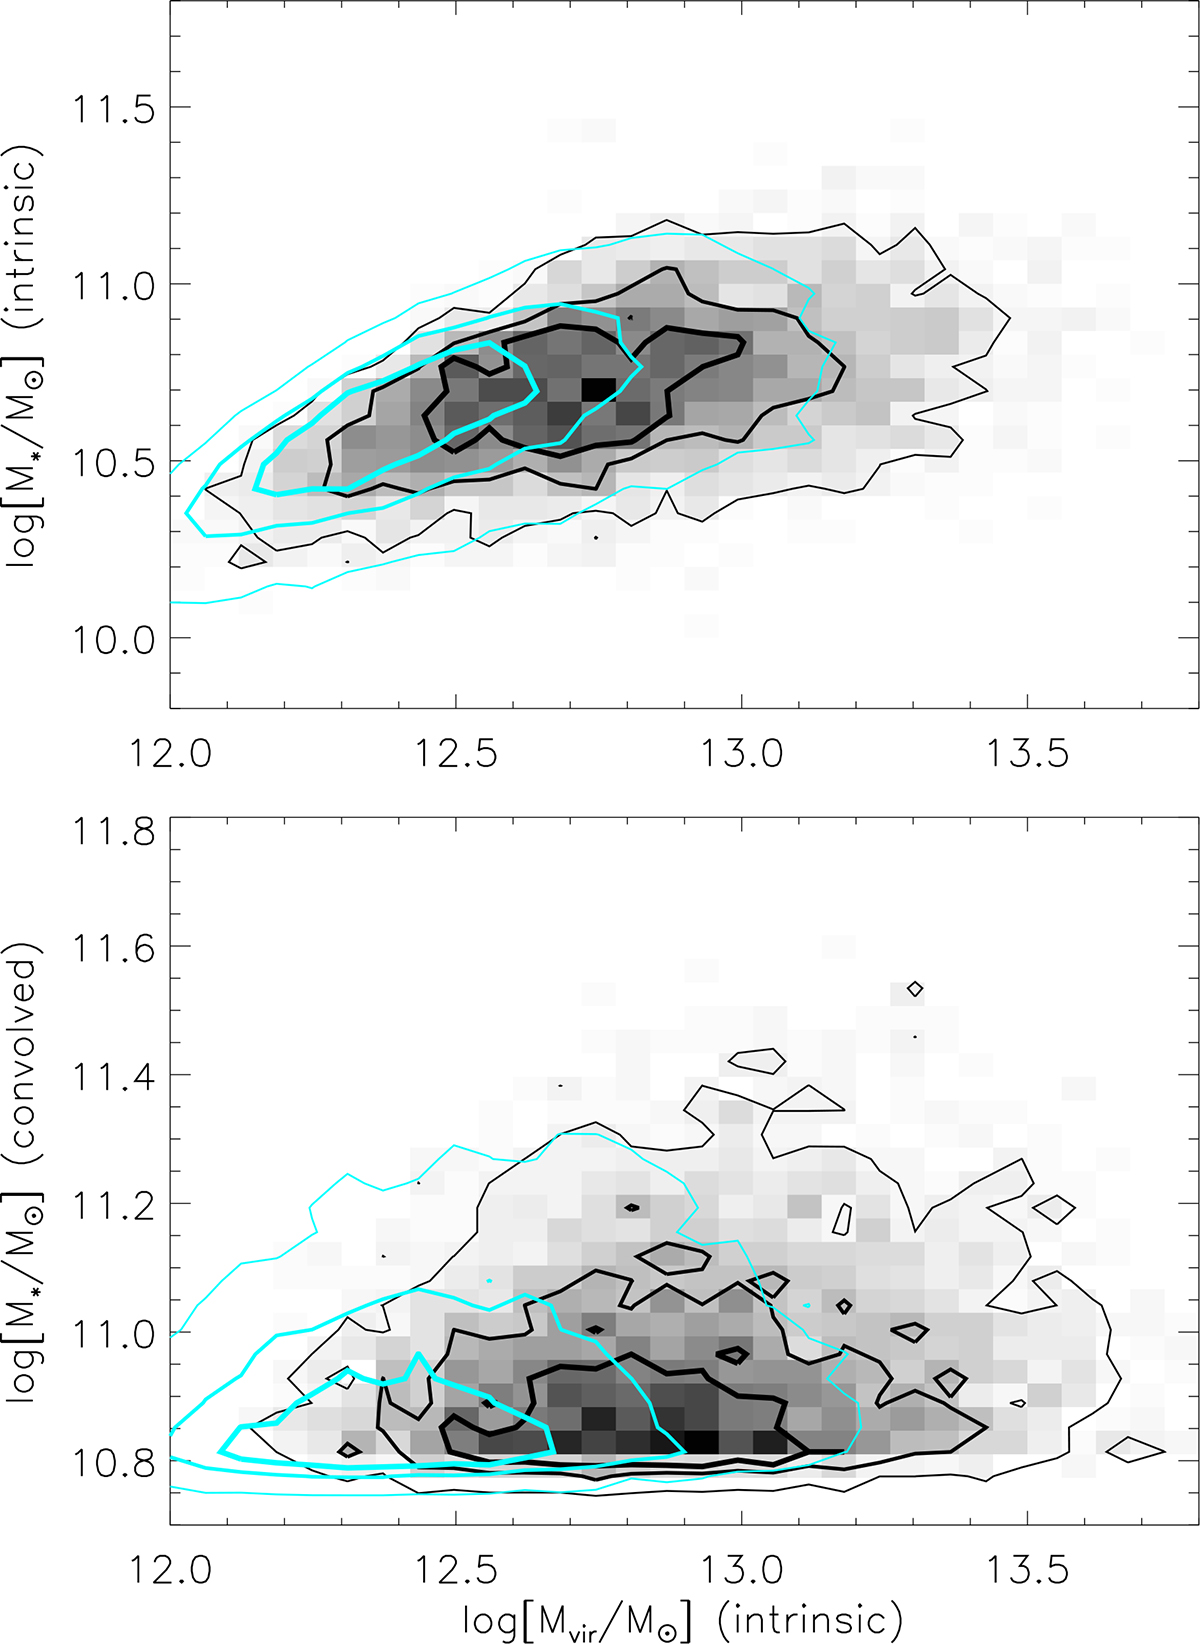
Top panel: Relation between stellar mass and parent halo virial mass for all galaxies selected at z ≳ 3.1 and z ≲ 5.3 (trends are similar when considering galaxies in smaller redshift ranges). Gray and cyan contours show the regions enclosing (from thicker to thinner lines) 30, 60, and 90% of the quiescent and star forming galaxies, respectively. Bottom panel: same as above, but including an estimate of the observational uncertainty (0.25 dex) in the galaxy stellar mass.
Current usage metrics show cumulative count of Article Views (full-text article views including HTML views, PDF and ePub downloads, according to the available data) and Abstracts Views on Vision4Press platform.
Data correspond to usage on the plateform after 2015. The current usage metrics is available 48-96 hours after online publication and is updated daily on week days.
Initial download of the metrics may take a while.