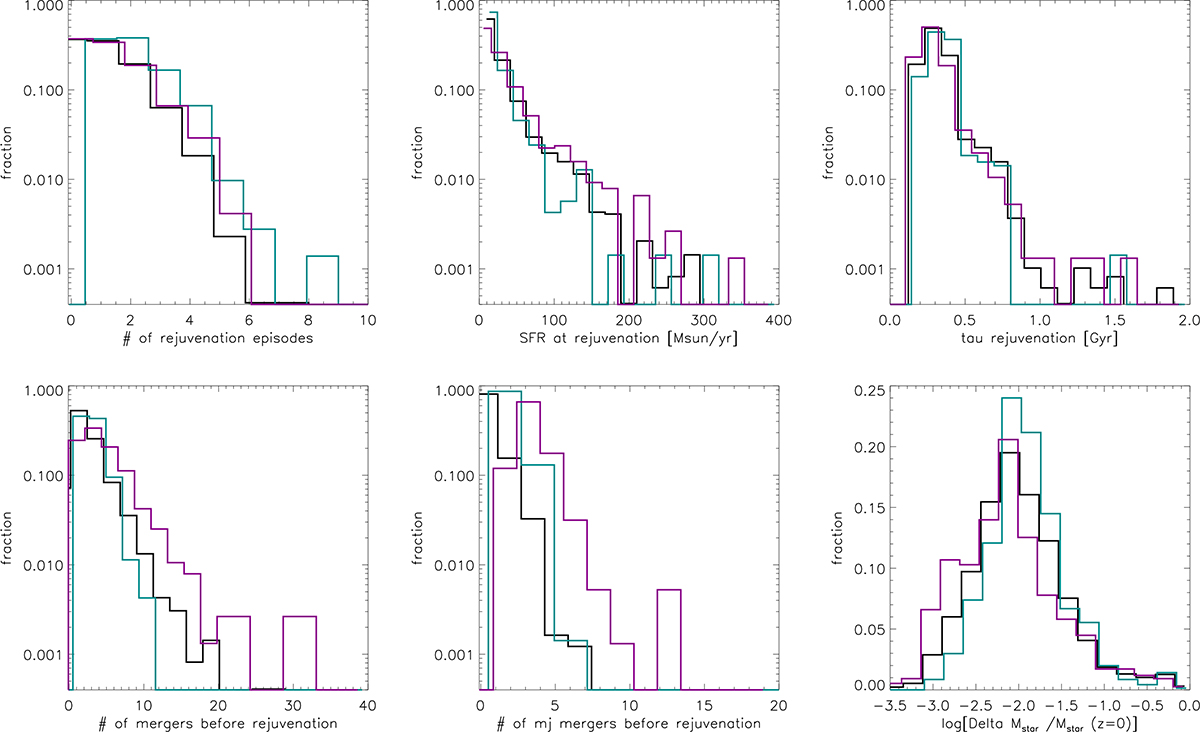
Fig. 10.
Download original image
Top panels: Distributions of the number of rejuvenation episodes, of the SFR during each episode, and of the associated timescale. Bottom panels: Distributions of the total number of mergers in the last snapshot just before the rejuvenation episodes, of the number of mergers with a mass ratio of at least 1/10, and of the associated fractional increase of stellar mass (excluding the stellar mass that is accreted through mergers). Magenta and cyan are for the 15th and 85th percentiles of the o3 distributions.
Current usage metrics show cumulative count of Article Views (full-text article views including HTML views, PDF and ePub downloads, according to the available data) and Abstracts Views on Vision4Press platform.
Data correspond to usage on the plateform after 2015. The current usage metrics is available 48-96 hours after online publication and is updated daily on week days.
Initial download of the metrics may take a while.