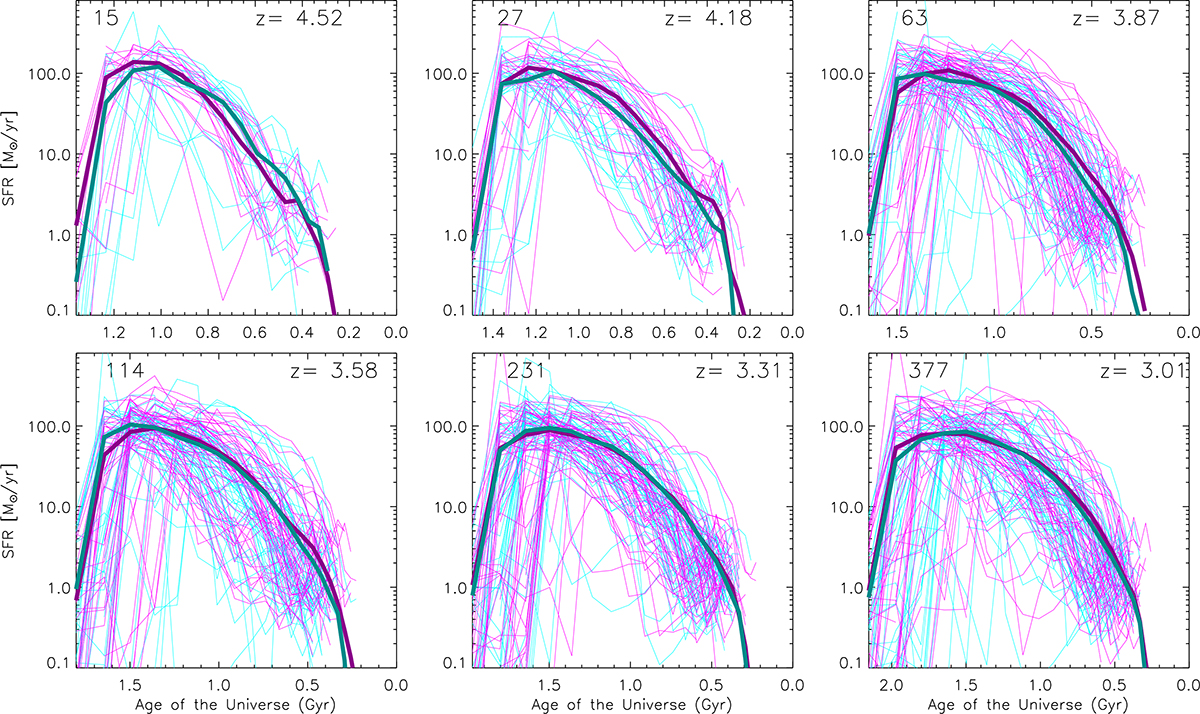
Fig. A.3.
Download original image
The star formation histories of galaxies in the bottom 25th (cyan) and highest 75th (magenta) percentiles of the distribution of o3. Ticker lines show the median star formation histories. The numbers of galaxies in each sub-sample at each snapshot is given in the top left corner. A maximum of 50 individual star formation histories in each subsample is shown to avoid overcrowding the panels.
Current usage metrics show cumulative count of Article Views (full-text article views including HTML views, PDF and ePub downloads, according to the available data) and Abstracts Views on Vision4Press platform.
Data correspond to usage on the plateform after 2015. The current usage metrics is available 48-96 hours after online publication and is updated daily on week days.
Initial download of the metrics may take a while.