Open Access
Fig. A.4.
Download original image
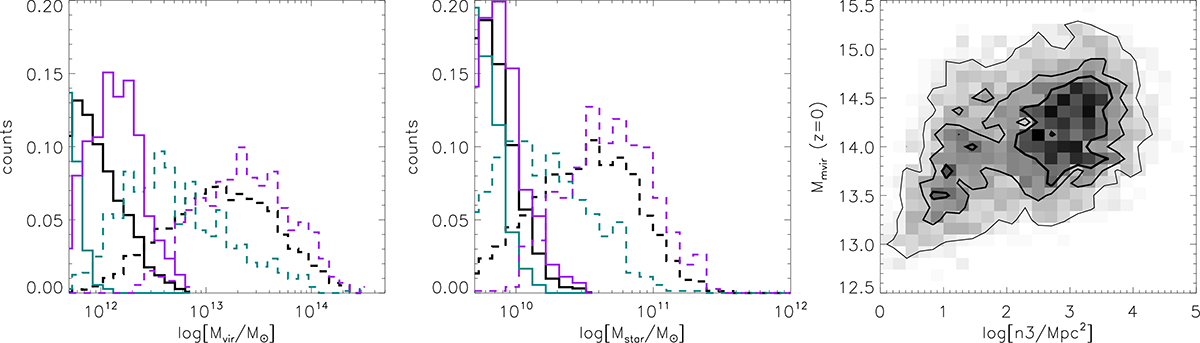
As in Fig. 9, but cyan and magenta histograms in the top and middle panel corresponds to galaxies in the extreme of the n3 distribution. The bottom panel shows the correlation between the halo mass in which descendants of quiescent high-z galaxies reside at z = 0 and n3 at the time of observation.
Current usage metrics show cumulative count of Article Views (full-text article views including HTML views, PDF and ePub downloads, according to the available data) and Abstracts Views on Vision4Press platform.
Data correspond to usage on the plateform after 2015. The current usage metrics is available 48-96 hours after online publication and is updated daily on week days.
Initial download of the metrics may take a while.