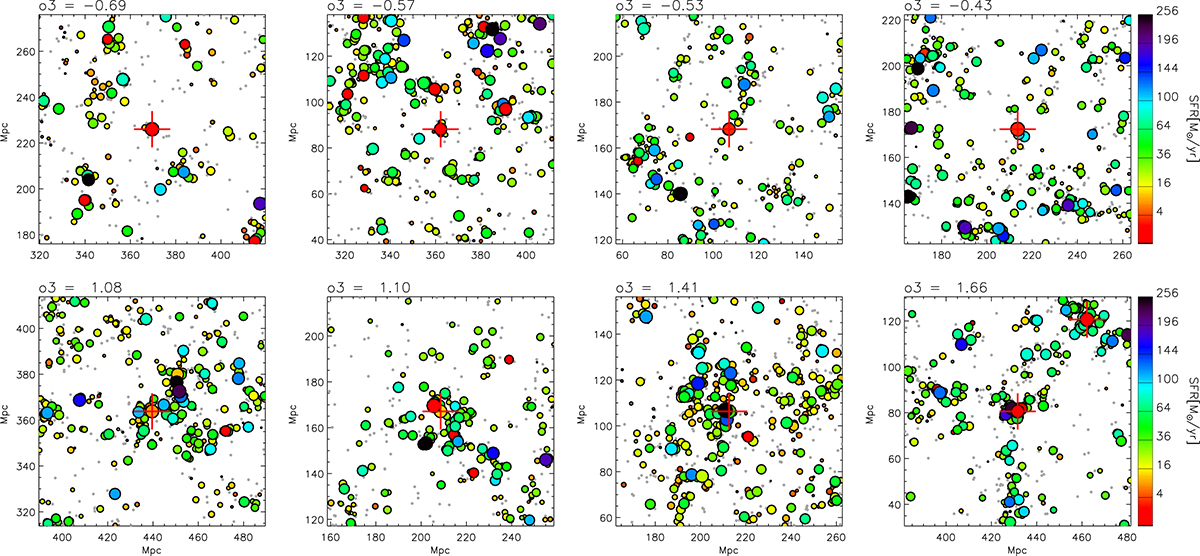
Fig. 3.
Download original image
Spatial distribution of galaxies selected at z ∼ 4.5 and with overdensities over a 3 Mpc scale in the lowest 15 (top panels) and highest 85 (bottom panels) percentiles of the distribution. Galaxies in our sample of massive quiescent galaxies are at the center of each panel and are marked by a red cross, while the other symbols mark the position of all galaxies more massive than 109 M⊙ in a projected region of 100 × 100 comoving Mpc, with a depth of 20 comoving Mpc. The o3 value corresponding to each field is indicated in the top left corner of each box. The color of the symbols scales with the galaxy SFR as indicated by the color bar on the right, while the symbol size scales with galaxy stellar mass. We note that we plot the most massive galaxies at the end to emphasize their position, so they may hide other galaxies that lie close in projection.
Current usage metrics show cumulative count of Article Views (full-text article views including HTML views, PDF and ePub downloads, according to the available data) and Abstracts Views on Vision4Press platform.
Data correspond to usage on the plateform after 2015. The current usage metrics is available 48-96 hours after online publication and is updated daily on week days.
Initial download of the metrics may take a while.