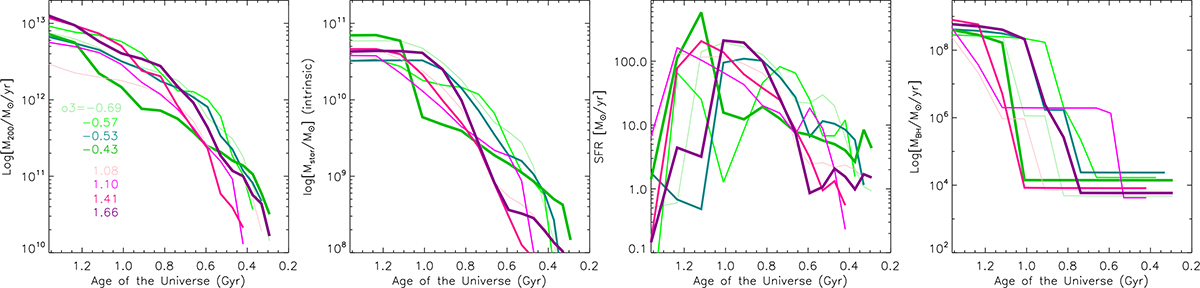
Fig. 4.
Download original image
Evolution of parent halo mass, galaxy stellar mass, SFR, and BH mass for the massive quiescent galaxies at z ∼ 4.5 considered in Fig. 3. Green and magenta lines refer to the top and bottom panels, respectively, with the thickness of the lines and color shade increasing with overdensity values as indicated in the legend included in the left panel. Different line styles are used to show different galaxies for clearer visualization. M200 and MBH are shown for the main progenitor at each previous cosmic epoch, while for the galaxy stellar mass and SFR we show the sum of all progenitors at the corresponding epoch.
Current usage metrics show cumulative count of Article Views (full-text article views including HTML views, PDF and ePub downloads, according to the available data) and Abstracts Views on Vision4Press platform.
Data correspond to usage on the plateform after 2015. The current usage metrics is available 48-96 hours after online publication and is updated daily on week days.
Initial download of the metrics may take a while.