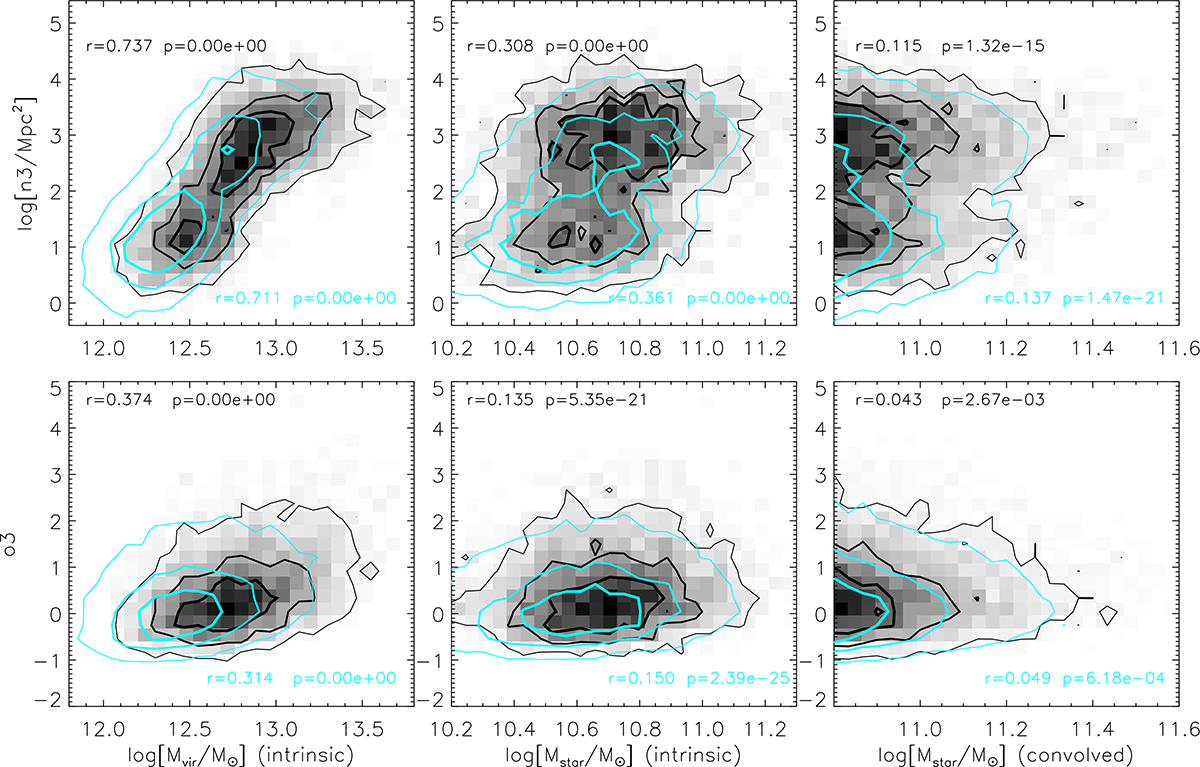
Fig. 5.
Download original image
Correlation between two different estimates of galaxy environment and the parent halo mass (left column), the intrinsic galaxy stellar mass (middle column), and the galaxy stellar mass including an estimate for its uncertainty (right column). The top panels are for n3, i.e., the local density (in physical Mpc−2) estimated considering the three closest neighbors for each galaxy in our quiescent (black) and star forming (cyan) samples. The bottom panels are for o3, i.e., the overdensity estimated considering a scale of 3 Mpc. The numbers in each panel correspond to the Spearman correlation coefficient and relative significance (a small value indicates a significant correlation) for quiescent galaxies (top left) and for star forming galaxies (bottom right).
Current usage metrics show cumulative count of Article Views (full-text article views including HTML views, PDF and ePub downloads, according to the available data) and Abstracts Views on Vision4Press platform.
Data correspond to usage on the plateform after 2015. The current usage metrics is available 48-96 hours after online publication and is updated daily on week days.
Initial download of the metrics may take a while.