Fig. 6.
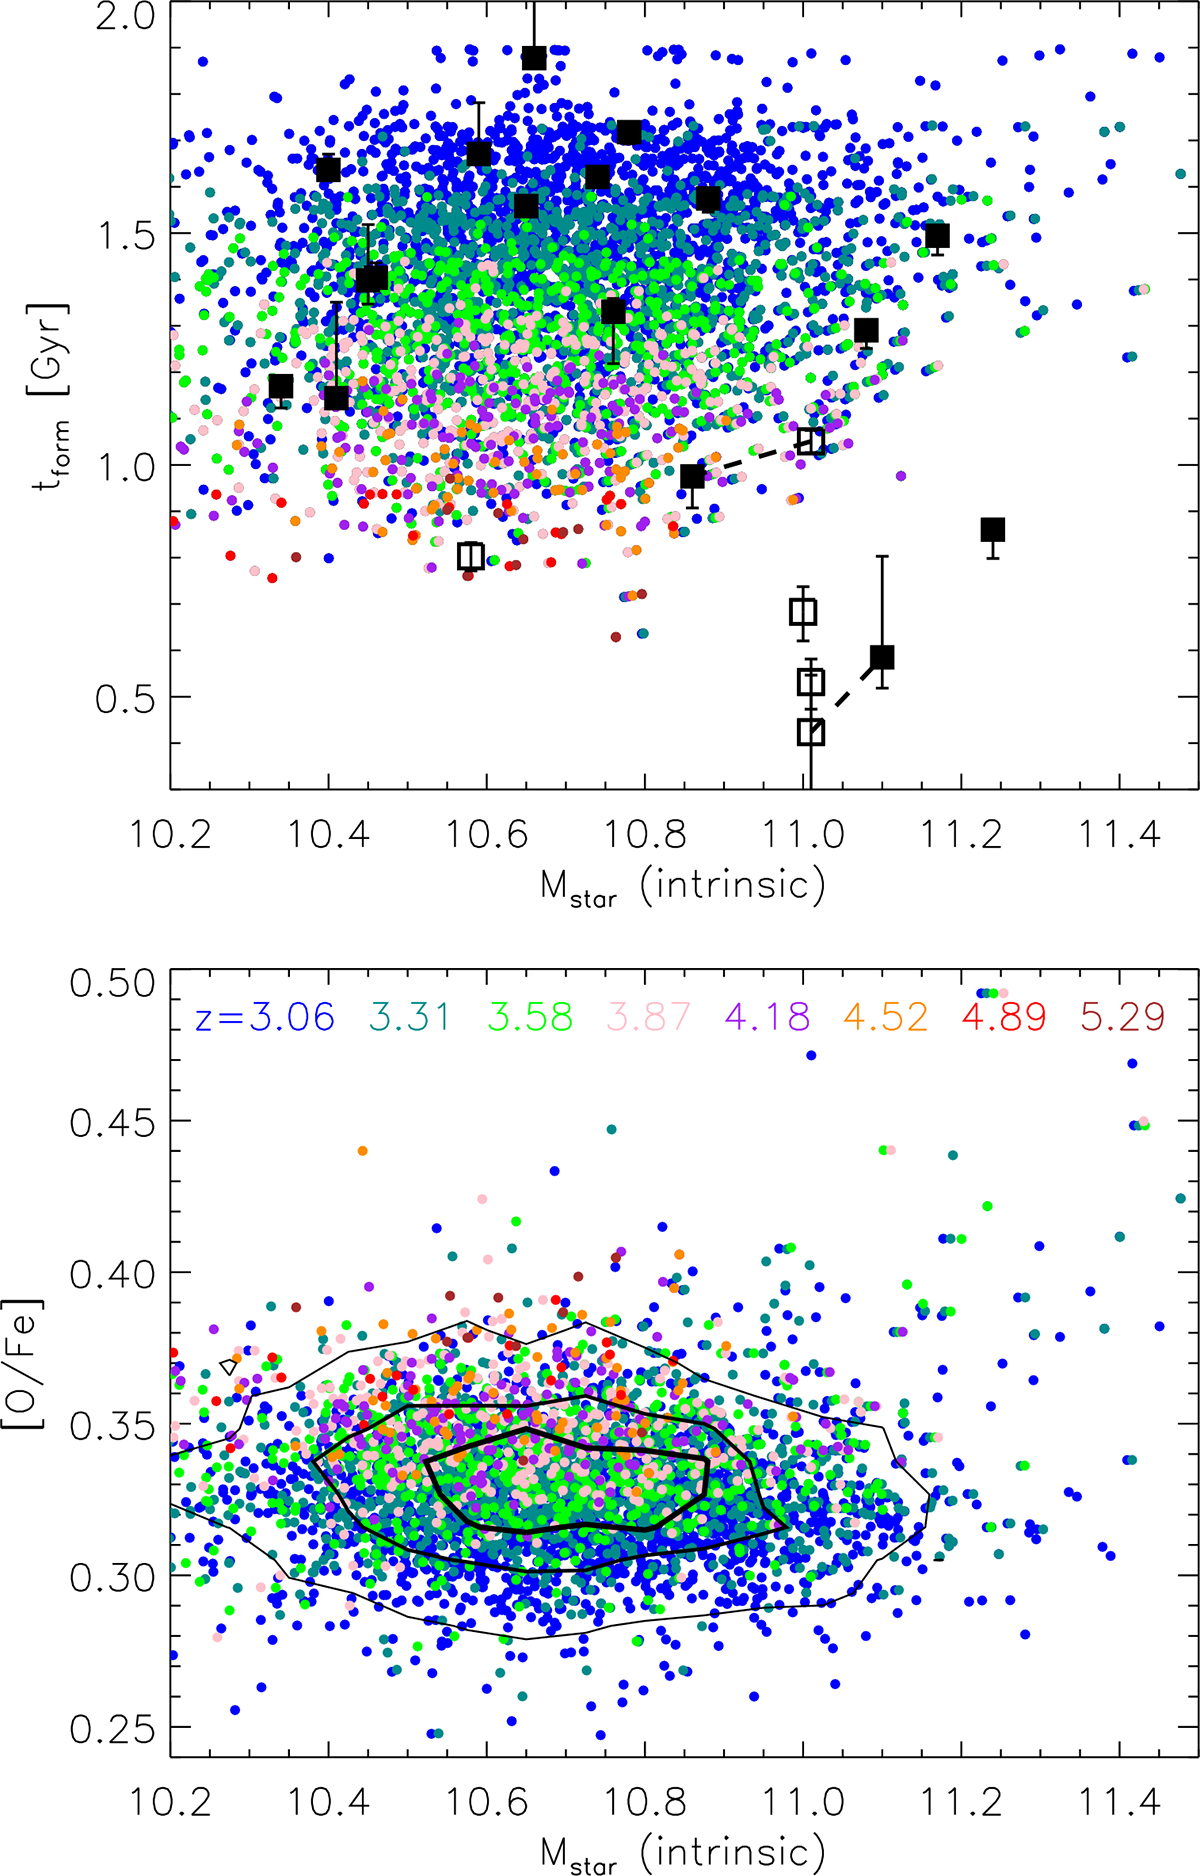
Download original image
Formation time (top panel) and [O/Fe] (bottom panel) as a function of galaxy stellar mass. The former is defined as the age of the Universe at which half of the stars in the galaxies were formed. Color coding is as a function of redshift, as indicated in the legend in the bottom panel. Open and filled symbols with error bars in the top panel correspond to observational measurements by Carnall et al. (2024, 5 galaxies between z ∼ 3.2 and z ∼ 4.6) and Nanayakkara et al. (2025, 19 galaxies with a median redshift of ∼3.55), respectively. Contours in the bottom panel show the regions enclosing (from thickest to thinnest) 30, 60, and 90% of the model sample.
Current usage metrics show cumulative count of Article Views (full-text article views including HTML views, PDF and ePub downloads, according to the available data) and Abstracts Views on Vision4Press platform.
Data correspond to usage on the plateform after 2015. The current usage metrics is available 48-96 hours after online publication and is updated daily on week days.
Initial download of the metrics may take a while.