Fig. 9.
Download original image
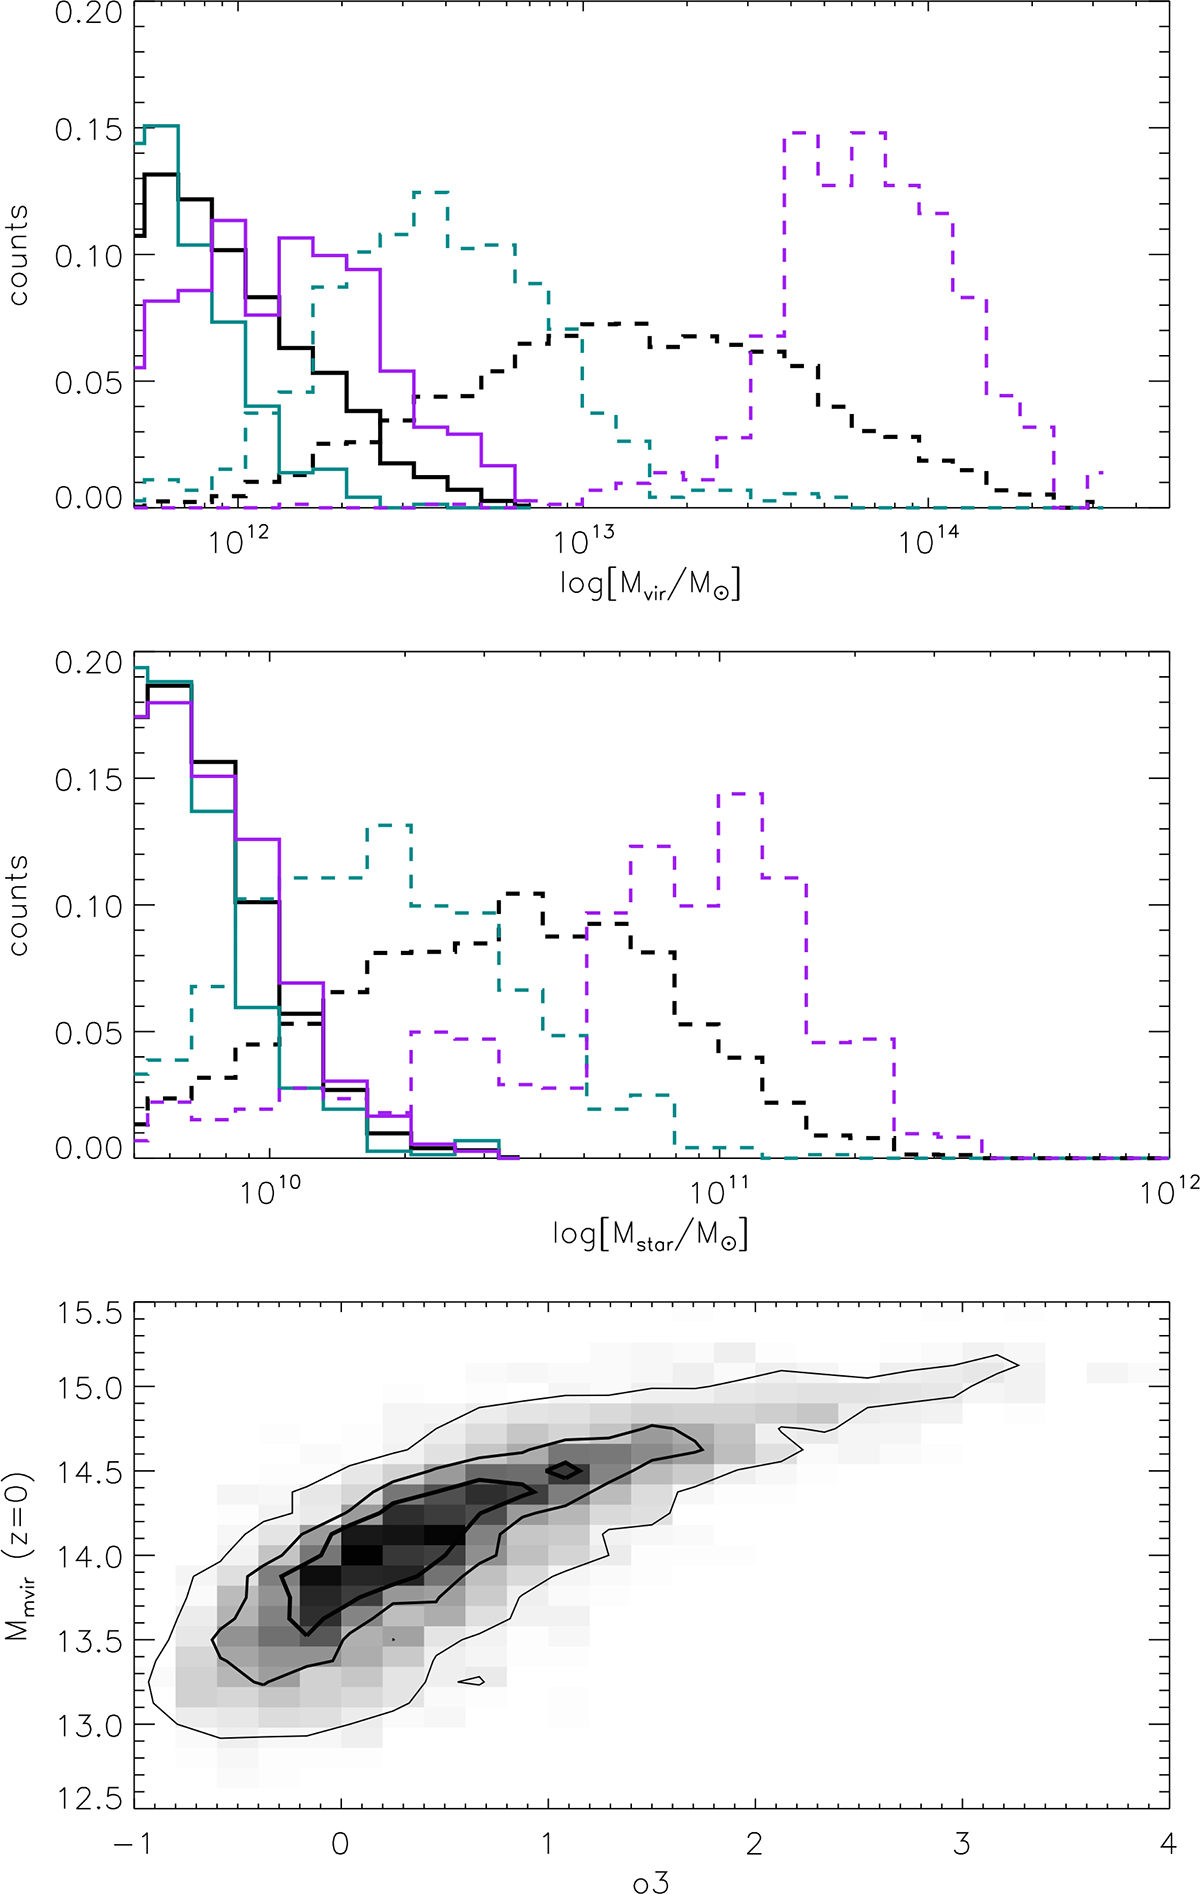
Solid histograms show the distribution of parent halo mass (top panel) and stellar mass (middle panel) for all quiescent model galaxies. Dashed histograms are the corresponding distributions for their descendants at z = 0. Cyan and magenta are used for galaxies that are in the extremes (15th and 85th percentiles) of the distribution of o3. The bottom panel shows the correlation between the virial mass of the halos in which descendants of galaxies in our sample reside at z = 0 and the overdensity at the time of the observation. Contours in the bottom panel show the regions enclosing (from thicker to thinner) 30, 60, and 90% of the galaxies.
Current usage metrics show cumulative count of Article Views (full-text article views including HTML views, PDF and ePub downloads, according to the available data) and Abstracts Views on Vision4Press platform.
Data correspond to usage on the plateform after 2015. The current usage metrics is available 48-96 hours after online publication and is updated daily on week days.
Initial download of the metrics may take a while.