Fig. 1
Download original image
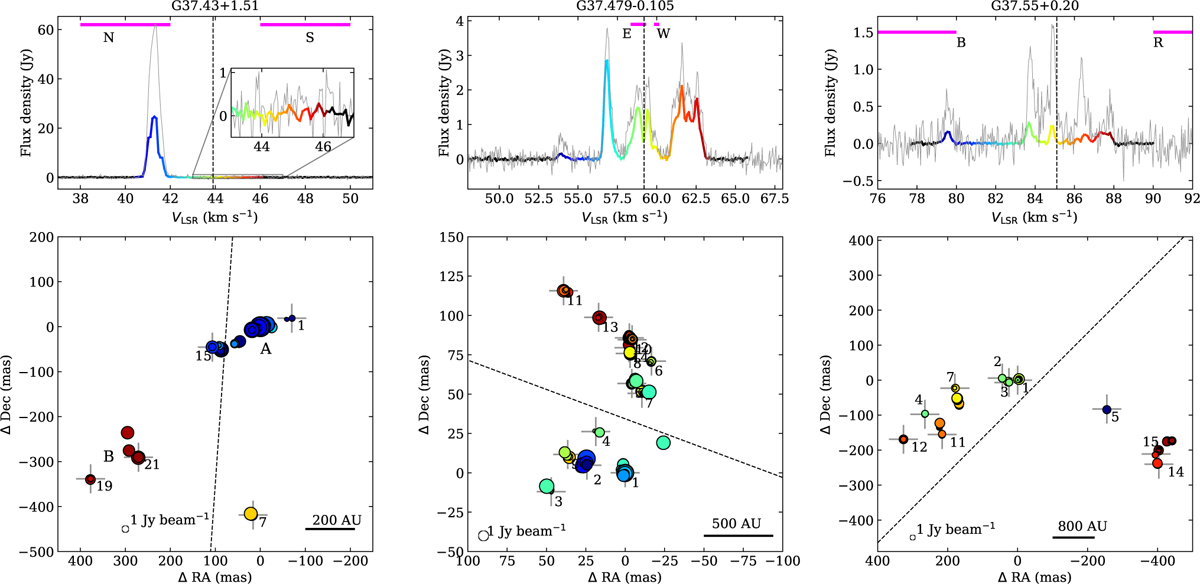
Top: maser spectra of G37.43+1.51, G37.479–0.105, and G37.55+0.20 as obtained by EVN (color) and the Ibaraki radio telescope (gray line) on 24 October 2023. The vertical dashed lines indicate the system velocities. The horizontal magenta lines indicate velocity ranges of outflow indicators: CO for G37.43+1.51 (López-Sepulcre et al. 2010), the 44 GHz class I methanol maser (Cyganowski et al. 2009) for G37.479–0.105, and the SO 219.949 GHz line (Silva et al. 2017) for the G37.55+0.20. Bottom: distribution of methanol maser spots. The colors correspond to the LSR velocity as in the spectrum. The spot size is proportional to the logarithm of its brightness. The cloudlets (crosses) are numbered as listed in Tables A.1, B.1 and C.1. Additionally, we show the association of A or B groups to maser cloudlets for G37.43+1.51, as introduced in Surcis et al. (2015). The dashed lines show the PAs (direction axis) of the outflows.
Current usage metrics show cumulative count of Article Views (full-text article views including HTML views, PDF and ePub downloads, according to the available data) and Abstracts Views on Vision4Press platform.
Data correspond to usage on the plateform after 2015. The current usage metrics is available 48-96 hours after online publication and is updated daily on week days.
Initial download of the metrics may take a while.