Fig. 4
Download original image
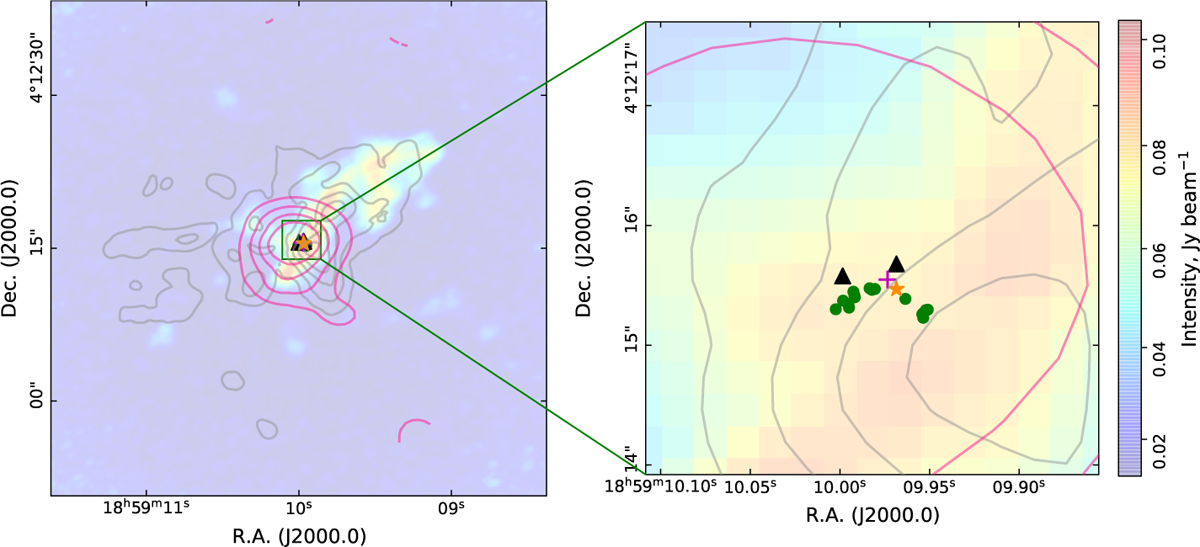
Color map of G37.55+0.20 representing the SiO 86.846 GHz line, overlaid with the H2CO line at 89.188 GHz (grey contours, with the first level 15 times the 4.3 mJy beam−1 rms and steps equal to that value), and the C17O line at 336.6291 GHz (deep-pink contours, with the first level at 2.1 mJy beam−1 and 1.6 mJy beam−1 steps). All data were obtained from the ALMA archive. The maximum of the C-band continuum with JVLA is represented with an orange star (Araya et al. 2007). The H2CO maser emission at 4.83 GHz is represented with a magenta cross (Araya et al. 2005). The black triangles represent the positions of the 22 GHz water masers, as observed by JVLA (Beuther et al. 2002b). The Finlay 6.7 GHz methanol maser emission from this work is represented by green circles.
Current usage metrics show cumulative count of Article Views (full-text article views including HTML views, PDF and ePub downloads, according to the available data) and Abstracts Views on Vision4Press platform.
Data correspond to usage on the plateform after 2015. The current usage metrics is available 48-96 hours after online publication and is updated daily on week days.
Initial download of the metrics may take a while.