Fig. 10
Download original image
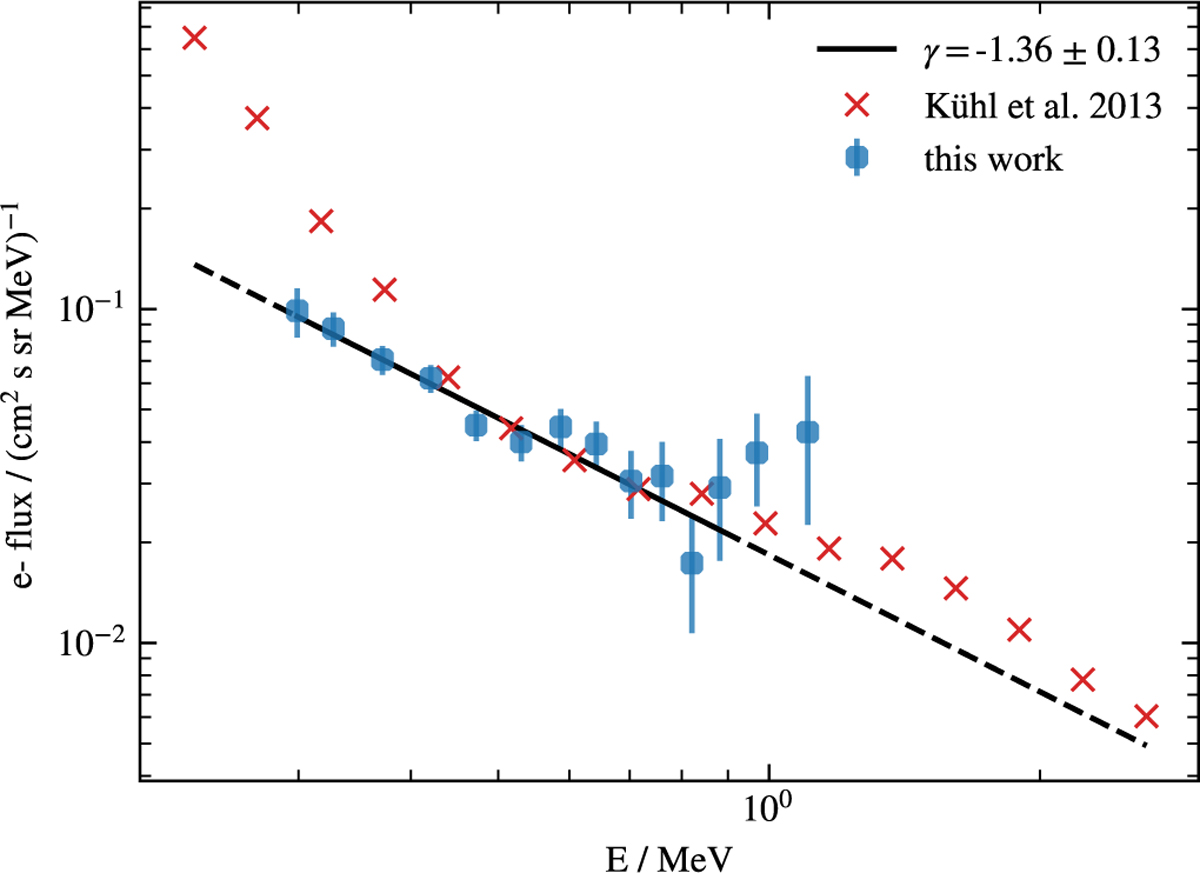
Spectrum of Jovian electrons averaged over seven time intervals with good connection to Jupiter in 2007 and 2008. Red crosses indicate the spectrum determined by Kühl et al. (2013), while blue dots represent the spectrum obtained with our new data product. The black line represents a power-law fit to the blue data points; the solid line indicates the data points used for the fit.
Current usage metrics show cumulative count of Article Views (full-text article views including HTML views, PDF and ePub downloads, according to the available data) and Abstracts Views on Vision4Press platform.
Data correspond to usage on the plateform after 2015. The current usage metrics is available 48-96 hours after online publication and is updated daily on week days.
Initial download of the metrics may take a while.