Fig. B.1
Download original image
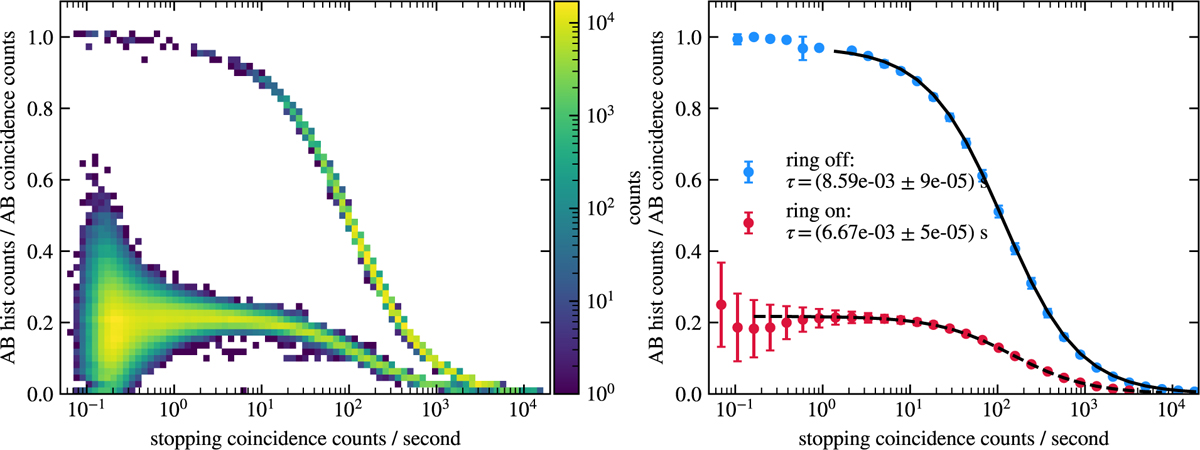
Left: A two-dimensional histogram showing the ratio between the counts in the first histogram and the coincidence counters for particles stopping in the B detector. The bottom curve represents data taken during the "ring on" state, while the top curve corresponds to the "ring off" state. Right: Mean values of slices taken from the 2D histogram shown in the left panel. The error bars indicate the standard deviation within each slice.
Current usage metrics show cumulative count of Article Views (full-text article views including HTML views, PDF and ePub downloads, according to the available data) and Abstracts Views on Vision4Press platform.
Data correspond to usage on the plateform after 2015. The current usage metrics is available 48-96 hours after online publication and is updated daily on week days.
Initial download of the metrics may take a while.