Open Access
Fig. 2
Download original image
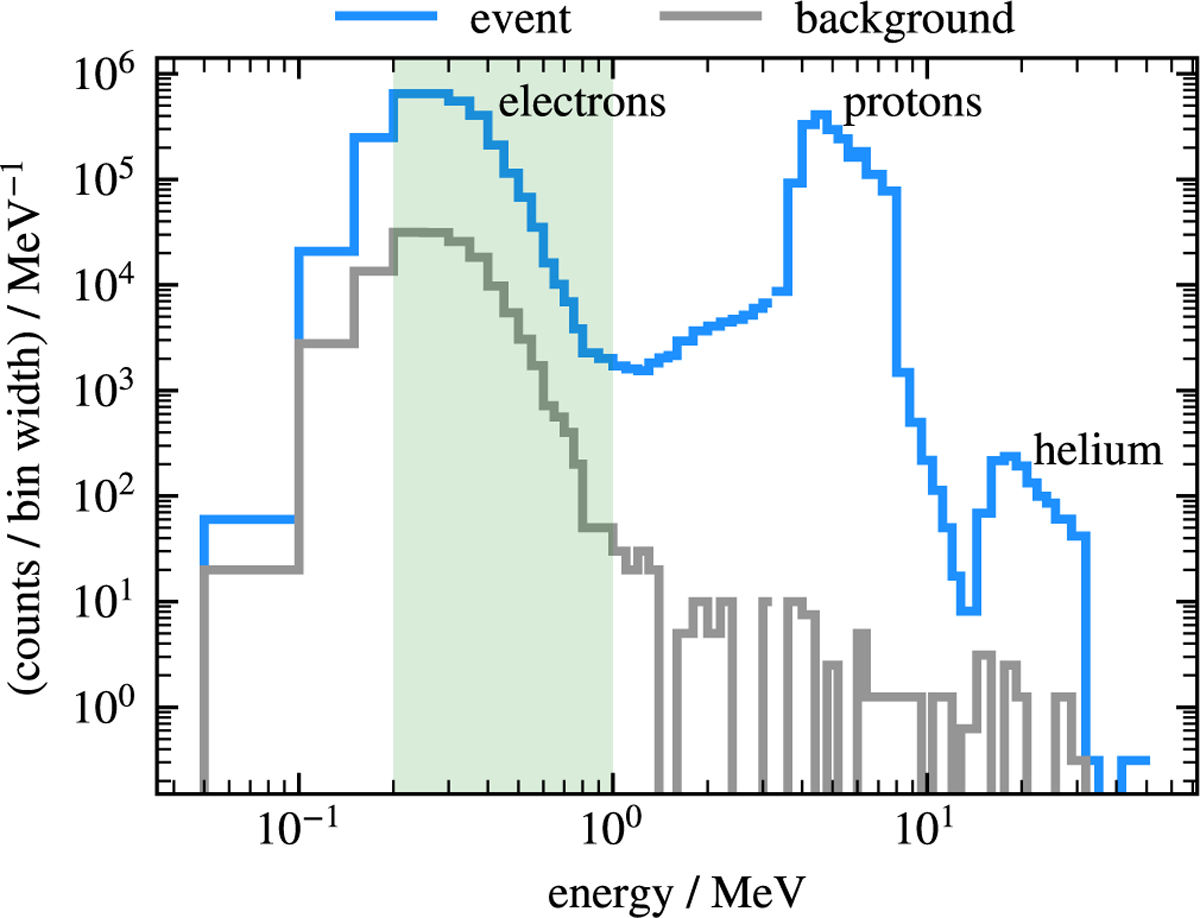
Histograms recorded during a particle event on May 29, 2021 (blue) and the pre-event background (gray), each with an integration time of approximately 24 hours. The green area marks the range of histogram bins used in the data product.
Current usage metrics show cumulative count of Article Views (full-text article views including HTML views, PDF and ePub downloads, according to the available data) and Abstracts Views on Vision4Press platform.
Data correspond to usage on the plateform after 2015. The current usage metrics is available 48-96 hours after online publication and is updated daily on week days.
Initial download of the metrics may take a while.