Fig. 4
Download original image
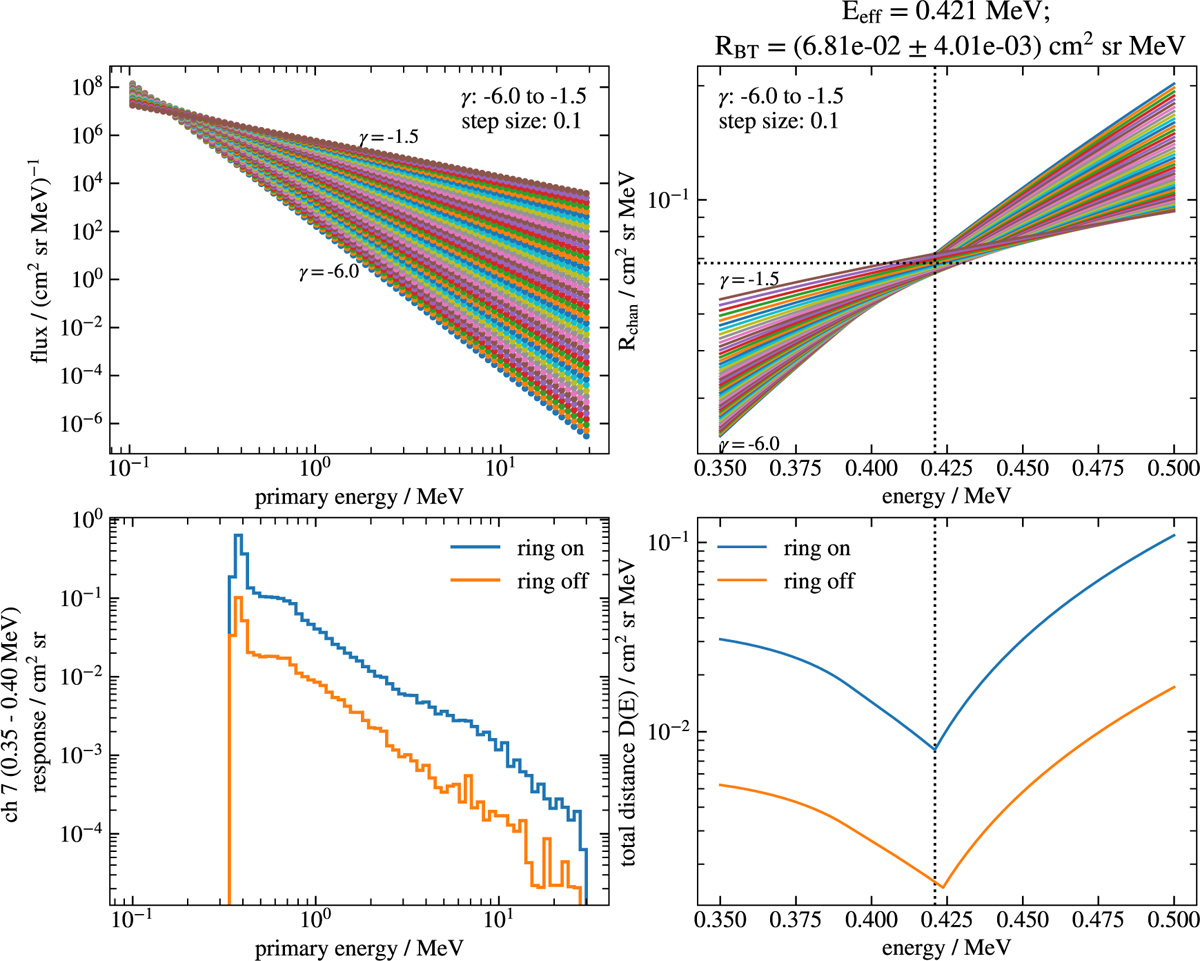
Top left: power-law input spectra with a spectral index ranging from −6.0 to −1.5 in steps of 0.1. Bottom left: response function of the seventh histogram channel. Top right: channels response factors, calculated using Eq. (4), plotted against an energy interval around the channel’s nominal energy range. The effective energy Eeff and characteristic response RBT are indicated by dotted horizontal and vertical lines, respectively. Bottom right: total distance between the response factors (see text), with effective energy corresponding to the minimum of this distance.
Current usage metrics show cumulative count of Article Views (full-text article views including HTML views, PDF and ePub downloads, according to the available data) and Abstracts Views on Vision4Press platform.
Data correspond to usage on the plateform after 2015. The current usage metrics is available 48-96 hours after online publication and is updated daily on week days.
Initial download of the metrics may take a while.