Fig. 6
Download original image
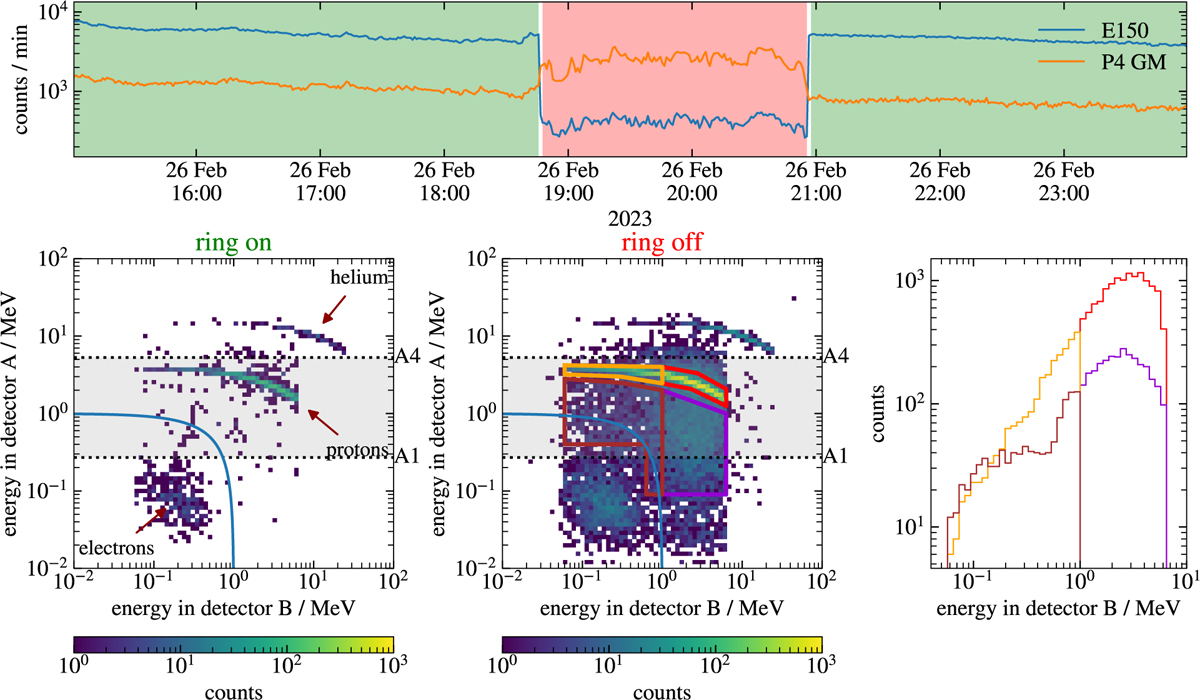
Top: count rates of the E150 and the P4GM coincidence counters during an automatic ring switch event of the instrument. Bottom left and middle: energy deposition in the A detector versus B detector during the “ring off” and “ring on” periods, respectively. The time intervals are highlighted in the top panel, with the “ring on” period in green and the “ring off” period in red. The blue curved line shows the highest measured energy used in this data product. The horizontal lines labeled with A1 and A4 indicate the energy thresholds used by the instrument to distinguish between protons, electrons, and helium particles. Bottom right panel: energy-loss distribution in SSD-B of all entries inside the corresponding boxes in the middle panel.
Current usage metrics show cumulative count of Article Views (full-text article views including HTML views, PDF and ePub downloads, according to the available data) and Abstracts Views on Vision4Press platform.
Data correspond to usage on the plateform after 2015. The current usage metrics is available 48-96 hours after online publication and is updated daily on week days.
Initial download of the metrics may take a while.