Fig. 4
Download original image
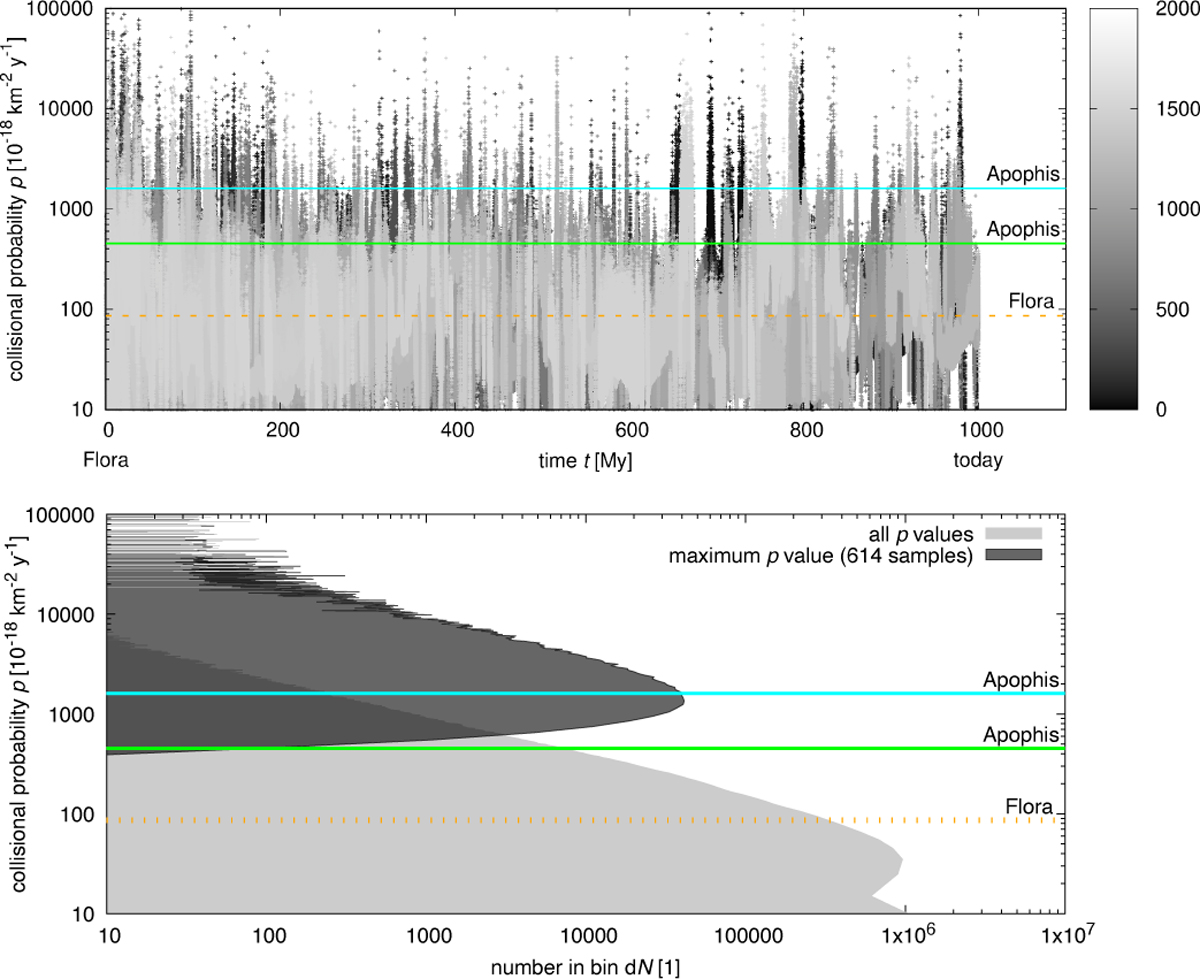
Top: collisional probabilities of LL-like NEOs originating from the Flora family and their temporal distribution. Individual bodies (out of 1900) are distinguished by shades of gray. The vertical range shows both low and high probabilities. For comparison, the horizontal lines indicate the mean probability p of all NEOs (orange), short-term initial probability p′ of Apophis (cyan), long-term probability p″ of Apophis (green). Bottom: Distribution of all p values (gray) and of the maximum p value (black).
Current usage metrics show cumulative count of Article Views (full-text article views including HTML views, PDF and ePub downloads, according to the available data) and Abstracts Views on Vision4Press platform.
Data correspond to usage on the plateform after 2015. The current usage metrics is available 48-96 hours after online publication and is updated daily on week days.
Initial download of the metrics may take a while.