Fig. 1.
Download original image
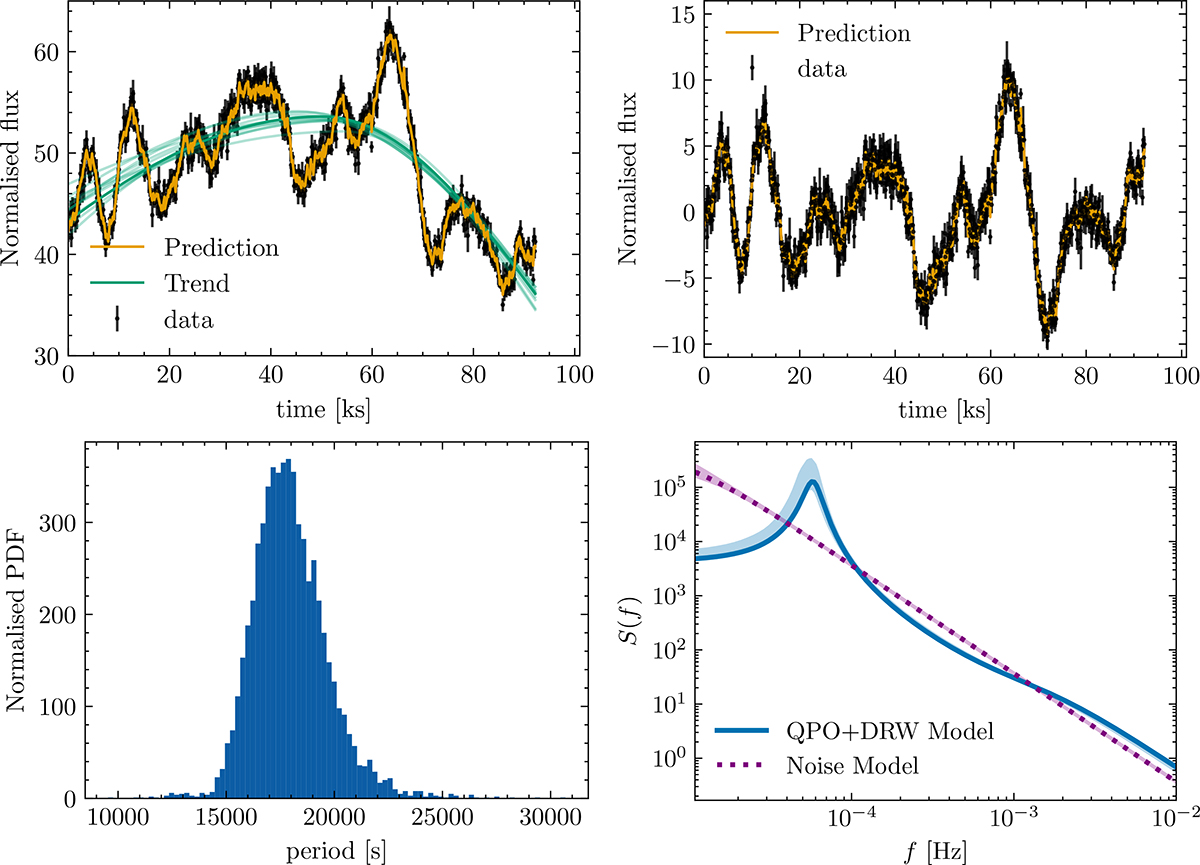
Gaussian process fitting results of the QPO+DRW model for NGC 1566. Top left: Background-subtracted XMM-Newton EPIC light curve of NGC 1566 in the 0.2–10 keV band (black dots with error bars), binned at 100 s. The light curve corresponds to the obs-ID 0800840201, for which NGC 1566 was in the outburst phase. The green curves represent the long-term trend modeled by a shewed Gaussian function, which describes the outburst profile well. The yellow curve is the sum of the best-fitting QPO+DRW model and the trend. Top right: Same as the top-left panel, but with the long-term trend (i.e., the green curve in the top panel) subtracted. Bottom left: Posterior distribution of the QPO period yielding ![]() . Bottom right: Best-fitting PSDs for the QPO+DRW model (blue curve) and the noise model (purple dots). The shaded regions indicate the 1σ confidence intervals.
. Bottom right: Best-fitting PSDs for the QPO+DRW model (blue curve) and the noise model (purple dots). The shaded regions indicate the 1σ confidence intervals.
Current usage metrics show cumulative count of Article Views (full-text article views including HTML views, PDF and ePub downloads, according to the available data) and Abstracts Views on Vision4Press platform.
Data correspond to usage on the plateform after 2015. The current usage metrics is available 48-96 hours after online publication and is updated daily on week days.
Initial download of the metrics may take a while.