| Issue |
A&A
Volume 708, April 2026
|
|
|---|---|---|
| Article Number | A241 | |
| Number of page(s) | 9 | |
| Section | Extragalactic astronomy | |
| DOI | https://doi.org/10.1051/0004-6361/202557983 | |
| Published online | 08 April 2026 | |
X-ray quasi-periodic oscillations in active galactic nuclei and their implications for the changing-look phenomenon
1
Department of Astronomy, Xiamen University, Xiamen, Fujian 361005, PR China
2
Department of Astronomy, University of Science and Technology of China, Hefei, Anhui 230026, PR China
3
School of Astronomy and Space Science, University of Science and Technology of China, Hefei, Anhui 230026, PR China
4
Yunnan Observatories, Chinese Academy of Sciences, Kunming 650216 Yunnan, PR China
5
Key Laboratory for the Structure and Evolution of Celestial Objects, Chinese Academy of Sciences, Kunming 650216 Yunnan, PR China
6
Center for Astronomical Mega-Science, Chinese Academy of Sciences, 20A Datun Road, Chaoyang District, Beijing 100012, PR China
7
Key Laboratory of Radio Astronomy and Technology, Chinese Academy of Sciences, 20A Datun Road, Chaoyang District, Beijing 100101, PR China
8
Shanghai Astronomical Observatory, Chinese Academy of Sciences, 80 Nandan Road, Shanghai 200030, PR China
9
College of Physics and Information Engineering, Quanzhou Normal University, Quanzhou, Fujian 362000, PR China
★ Corresponding author: This email address is being protected from spambots. You need JavaScript enabled to view it.
Received:
5
November
2025
Accepted:
25
February
2026
Abstract
X-ray timing of active galactic nuclei (AGNs) provides a unique probe of gas accretion onto supermassive black holes (SMBHs). Quasi-periodic oscillations (QPOs), which trace gas dynamics in the strongly curved spacetime around SMBHs, are rare in AGN. These signals are often analogs of high-frequency QPOs occasionally seen in some black-hole X-ray binaries, and their scarcity in AGN can partly be attributed to the low frequencies expected for typical SMBH masses. Intriguingly, robust X-ray QPO detections in SMBH systems have so far been reported only in narrow-line Seyfert 1 galaxies (NLS1s) and tidal disruption events (TDEs). Here we report the discovery of a QPO candidate during the 2018 outburst of the changing-look AGN (CL-AGN) NGC 1566. Numerical simulations indicate that the disk epicyclic oscillations responsible for high-frequency QPOs are damped by magnetohydrodynamic turbulence unless the accretion flow is misaligned and/or eccentric. In TDEs, the stellar debris stream is naturally misaligned with the SMBH spin, while NLS1s may host misaligned disks due to their youth. Motivated by the QPO candidate in NGC 1566, we propose that CL-AGN accretion is also misaligned – potentially fueled by captured, free-falling broad-line region clouds. This model naturally explains why CL-AGN transition timescales are much shorter than the standard disk viscous timescale. This picture can be tested by searching for QPOs or quasi-periodic eruptions in other CL-AGNs.
Key words: accretion / accretion disks / quasars: general / galaxies: Seyfert / X-rays: galaxies
© The Authors 2026
 Open Access article, published by EDP Sciences, under the terms of the Creative Commons Attribution License (https://creativecommons.org/licenses/by/4.0), which permits unrestricted use, distribution, and reproduction in any medium, provided the original work is properly cited.
This article is published in open access under the Subscribe to Open model. This email address is being protected from spambots. You need JavaScript enabled to view it. to support open access publication.
1. Introduction
The timing properties of active galactic nuclei (AGNs) provide unique insights into the structure and evolution of their central engine – the supermassive black hole (SMBH) and its accretion disk – which are otherwise too compact to be spatially resolved. For instance, stochastic variations in X-ray and UV/optical continua – likely driven by magnetohydrodynamic (MHD) turbulence (e.g., Balbus & Hawley 1998; Noble & Krolik 2009; Sun et al. 2020) in the corona or accretion disk – are often highly correlated. The variable ionizing continuum can photoionize high-velocity clouds around SMBHs, producing broad emission lines with time-varying fluxes, or be absorbed by a dusty torus and reemitted in the mid-infrared (MIR) bands. Reverberation mapping (Blandford & McKee 1982) measures the time lags between these flux variations, thereby constraining the emission-region sizes (for a recent review, see, e.g., Cackett et al. 2021) and enabling the estimation of SMBH masses (MBH) across cosmic time.
Timing studies have revealed significant challenges to our understanding of AGNs. On short timescales (hours to days), an interesting problem is the rarity of X-ray quasi-periodic oscillation (QPO) detections in AGNs (e.g., González-Martín & Vaughan 2012). Notably, QPOs with different frequencies are observed in various spectral states of black hole X-ray binaries (BHXRBs), and they can be used as powerful probes of accretion physics around stellar black holes (e.g., Remillard & McClintock 2006; Ingram & Motta 2019). If the accretion physics are scale invariant from the stellar black holes to SMBHs, AGNs should exhibit QPOs beyond stochastic variability in long X-ray exposures. For instance, counterparts to high-frequency BHXRB QPOs – probing the gas dynamics near the innermost stable orbits – should be detectable with tens of kiloseconds of XMM-Newton observations. The identification of AGN analogs of low-frequency QPOs (0.1–30 Hz) requires very long X-ray light curves. Over the past two decades, there have only been a few robust AGN QPO detections (e.g., Gierliński et al. 2008; Jin et al. 2021; Xia et al. 2024; Zhang et al. 2025a), possibly due to observational limitations and red noise contamination (e.g., Vaughan 2005, 2013). González-Martín & Vaughan (2012) systematically analyzed the XMM-Newton light curves of 104 AGNs and only identified one source (RE J1034+396, which is firstly discovered by Gierliński et al. 2008) with QPO signals. Nevertheless, QPOs have been detected (e.g., Pasham et al. 2019; Masterson et al. 2025; Zhang et al. 2025b) in five or more tidal disruption events (TDEs; see, e.g., Rees 1988), which are extra-galactic transients that occur when a star is tidally disrupted and subsequently accreted by an SMBH. Hence, the QPO detection rate seems to be unusually high in TDEs because only several dozen TDEs have been monitored with intensive X-ray observations (e.g., Gezari 2021).
On long timescales (months to years), AGNs show an unexpected “changing-look” (CL) behavior (e.g., Alloin et al. 1986; MacLeod et al. 2016; Guo et al. 2019, 2024; Dong et al. 2025), where their broad emission lines disappear and/or reappear. Multiwavelength variability studies have confirmed that these CL AGNs (CL-AGNs) undergo large accretion rate variations – not dust-extinction changes – on timescales of years (for a recent review, see Ricci & Trakhtenbrot 2023). The variability timescales of CL-AGNs are two to three orders of magnitude shorter than the predicted viscous timescales (e.g., Lawrence 2018). This inconsistency presents a serious challenge to the standard accretion disk model (Shakura & Sunyaev 1973), which successfully explains the thermal spectral state of BHXRBs (Remillard & McClintock 2006). This discrepancy may indicate strong magnetic field effects (e.g., Dexter & Begelman 2019; Feng et al. 2021; Ma et al. 2025), disk instabilities (e.g., Sniegowska et al. 2020), or a distinct gas accretion process in AGNs (e.g., Liu et al. 2021). Together, these two problems highlight our poor understanding of time-dependent SMBH accretion (e.g., Antonucci 2013) on short and long timescales.
The two problems could be closely related. High-frequency QPOs in BHXRBs are found exclusively in the steep power-law (SPL) state with a strong SPL spectral component. The SPL state typically occurs around the peak of a BHXRB outburst (e.g., Remillard & McClintock 2006), is associated with a large Eddington ratio and transient jet ejections (e.g., Massi 2011), and is presumably powered by an unsteady accretion-flow structure. Thus, the analogs of high-frequency QPOs in AGNs could also be associated with unusual accretion processes with unstable gas inflow. A number of models have been proposed to explain low-frequency and high-frequency QPOs in XRBs (e.g., Stella et al. 1999; Abramowicz & Kluźniak 2001; Li & Narayan 2004; Kato et al. 2008; You et al. 2018). Interestingly, recent MHD simulations (Dewberry et al. 2020) suggest that MHD turbulence driven by magnetorotational instability, which is critical for removing angular gas momentum (e.g., Balbus & Hawley 1998), can effectively damp the inertial oscillations (i.e., the g-mode; see, e.g., Kato et al. 2008) in the very attractive high-frequency QPO model, the discoseismic model (for a brief discussion, see, e.g., Smith et al. 2021). If this is the case, then other mechanisms involving warped and/or eccentric gas inflows would be required to excite (e.g., Kato 2004; Ferreira & Ogilvie 2008; Henisey et al. 2009) and maintain inertial oscillations (see, e.g., Dewberry et al. 2020; Musoke et al. 2023; Bollimpalli et al. 2024) at the radial epicyclic frequency. Consequently, such mechanisms might also provide clues to our understanding of long-term AGN variability (e.g., the CL phenomenon).
In this work, we are hence motivated to search for possible X-ray high-frequency QPOs in the repeating CL-AGN NGC 1566 (e.g., Alloin et al. 1986; Oknyansky et al. 2019; Ochmann et al. 2024). This source is an ideal target for the following reasons. First, the CL transitions are likely driven by large accretion-rate fluctuations, which may also amplify inertial oscillations in the innermost regions. Second, a millihertz QPO is reported in the outburst of the CL-AGN 1ES 1927+654. Third, NGC 1556 is frequently observed by XMM-Newton and other X-ray facilities (e.g., Jana et al. 2021) during its 2018 outburst (e.g., Oknyansky et al. 2019). Fourth, NGC 1566 shows significant Fe II emission during the 2018 outburst, indicating a large peak Eddington ratio. Estimates of this peak Eddington ratio range from 6% to 12%, depending upon the SMBH mass (e.g., Jana et al. 2021; Ochmann et al. 2024). Furthermore, this source is classified as a narrow-line Seyfert 1 (NLS1) by Xu et al. (2024), a class often considered the AGN analogy of BHXRBs in the SPL state. Fifth, given its SMBH mass MBH = 4 ∼ 8 × 10⁶ M⊙ (Ochmann et al. 2024), the expected period of the high-frequency QPO, which should be ≃2000 ∼ 4000 s according to the scaling relation of BHXRBs (Remillard & McClintock 2006), can be probed by XMM-Newton observations.
The paper is organized as follows: In Sect. 2, we describe the QPO detection methodology. In Sect. 3, we present the QPO detection result. In Sect. 4, we discuss the physical implications. Finally, the main conclusions are summarized in Sect. 5.
2. Data and QPO identification
2.1. Light curve extraction
We searched for QPOs in the 2018 outburst of the repeating CL-AGN NGC 1566 (e.g., Alloin et al. 1986; Oknyansky et al. 2019; Jana et al. 2021; Ochmann et al. 2024). From November 2015 to August 2019, NGC 1566 was observed five times by XMM-Newton. We focus on the XMM-Newton observations (for a summary, see, e.g., table 1 of Jana et al. 2021) with obs-IDs of 0800840201 (2018-06-26), 0820530401 (2018-10-04), and 0840800401 (2019-06-05), which are the three observations with the highest count rates and longest exposure times among the five exposures. The exposure times for the observations 0800840201, 0820530401, and 0840800401 are 94 ks, 108 ks, and 94 ks, respectively. We do not consider NuSTAR observations because their count rates are too low to probe QPOs. We locally ran SAS (version:22.1.0) with the latest calibration files to reduce the data and extract the 0.2–10 keV light curves. We processed the raw observation data files using the epproc task to obtain calibrated EPIC event files. Next, we applied the evselect and tabgtigen tasks to select good time intervals without background flares (RATE< = 2 within 10 s in the 10–12 keV band). Additionally, only single- and double-pixel events were retained (PATTERN < = 4 and FLAG= = 0). The source area was selected a 30″ radius circle around the center of the source. The background area was selected a 50″ radius circle that is free of sources. We extracted the source and background light curves using the evselect task, and then we used the epiclccorr task to generate the background-removed light curves. The generated light curves for obs-IDs of 0800840201, 0820530401, and 0840800401 were rebinned in time bins of 100 s. This time resolution is sufficiently small for our periods of interested.
2.2. QPO identification
Robustly searching for QPOs in AGNs is challenging. The AGN variability resembles “red” noise (for a review, see e.g., Vaughan 2013, and references therein), which can mimic periodic signals (e.g., Vaughan 2005). Several methods have been proposed for QPO detection, such as the standard fast Fourier transform (FFT); the popular Lomb-Scargle periodogram (e.g., Scargle 1982), which can deal with irregular and gappy light curves; and the weighted wavelet Z-transform (e.g., Foster 1996). Due to the stochastic nature of AGN variability, computationally heavy Monte Carlo resampling is often adopted to estimate the statistical significance of potential QPO signals.
Recently, Gaussian processes (GPs) have been introduced to model AGN light curves and search for QPOs in the time domain (e.g., Foreman-Mackey et al. 2017; Hübner et al. 2022a,b; Yu et al. 2022; Zhang et al. 2023). The GP method is particularly powerful in dealing with irregularly sampled light curves with heterogeneous measurement uncertainties. This approach assumes AGN flux variations are a stochastic process and follow a multivariate Gaussian distribution. By optimizing the covariance (kernel) function of the light curve, GPs model the underlying AGN variability and obtain the QPO parameters (for more details, see, e.g., Hübner et al. 2022b, and references therein). Moreover, the GP method can also self-consistently model non-stationary signals, including but not limited to outburst light curves, by introducing long-term mean functions (e.g., Hübner et al. 2022a,b). This advantage is particularly relevant for probing X-ray QPOs in the 2018 outburst of NGC 1566, which show a fast rise but slow decay (Figure 1 in Jana et al. 2021).
Following Hübner et al. (2022a), we modeled the potential QPO signal (hereafter the DRW+QPO model) using the following composite GP kernel function:
 (1)
(1)
with
 (2)
(2)
where A is the QPO amplitude, PQPO is the QPO period, τQPO is the decay timescale, and kDRW(Δt) is the kernel function of a damped random walk (DRW) process:
 (3)
(3)
Here, Δt is the time interval between two observations, σ is the variability amplitude, and τDRW is the damping timescale. We fit this DRW+QPO model to the rebinned XMM-Newton light curve.
While AGN stochastic variability is often described by a DRW process (e.g., Kelly et al. 2009), there is evidence indicating more complex GP kernel functions (e.g., Kasliwal et al. 2015). Here, we set the null hypothesis model (hereafter the noise model) by fixing PQPO in Eq. (1) to be an extremely large value (i.e., 106 s). That is, this special kernel is identical to a summation of two DRW processes with different parameters and can fit the non-DRW noise. Similar to the DRW+QPO model, we fit the noise model to the same XMM-Newton light curve.
As pointed out by Hübner et al. (2022b), the “mean” function, which describes the long-term and/or non-stationary trend in a light curve, plays an important role in identifying QPOs. Again, following (Hübner et al. 2022b, see their Section 2.3), we considered the five long-term mean functions: constant, polynomial functions, skewed Gaussian functions, skewed exponential functions, and fast-rise exponential decay (FRED) functions. Then, we used the QPOEstimation1 package (Hübner et al. 2022b) to fit the rebinned XMM-Newton light curve of NGC 1566, obtaining the corresponding Bayesian evidence (see Eq. 11 in Hübner et al. 2022a) and best-fitting kernel parameters for the noise model and the DRW+QPO model. For each model, all five mean functions were considered.
We compared the DRW+QPO and noise models using the Bayes factor (Zhu & Thrane 2020; Hübner et al. 2022a). The natural logarithmic Bayes factor is (Hübner et al. 2022b),
 (4)
(4)
where 𝒵QPO + DRW and 𝒵noise are the Bayesian evidence of the DRW+QPO and noise models, respectively. The Bayes factor is a measure of the relative evidence provided by the light curve for the QPO+DRW over the noise models. Following previous works (Kass & Raftery 1995; Zhu & Thrane 2020), we treated lnℬℱ > 3 as strong and lnℬℱ > 5 as very strong support for the QPO+DRW model over the noise model.
An example of the GP modeling for obs-ID 0800840201 is shown in Figure 1. For this observation, the best-fitting “mean” function is a skewed Gaussian function (constant) for the QPO+DRW (noise) model. For the QPO+DRW model, a QPO signal is prominent in the best-fitting power spectral density (PSD). For the noise model, the best-fitting PSD follows a power-law shape. The corresponding lnℬℱ = 4.5 (i.e., strong support for the QPO+DRW model), and the best-fitting period is  . For the remaining two XMM-Newton light curves, the corresponding lnℬℱ values are close to or smaller than zero. Hence, we focus on obs-ID 0800840201.
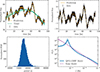 |
Fig. 1. Gaussian process fitting results of the QPO+DRW model for NGC 1566. Top left: Background-subtracted XMM-Newton EPIC light curve of NGC 1566 in the 0.2–10 keV band (black dots with error bars), binned at 100 s. The light curve corresponds to the obs-ID 0800840201, for which NGC 1566 was in the outburst phase. The green curves represent the long-term trend modeled by a shewed Gaussian function, which describes the outburst profile well. The yellow curve is the sum of the best-fitting QPO+DRW model and the trend. Top right: Same as the top-left panel, but with the long-term trend (i.e., the green curve in the top panel) subtracted. Bottom left: Posterior distribution of the QPO period yielding |

To further justify our QPO detection, we performed the standard FFT analysis for obs-ID 0800840201. We could use the standard FFT analysis because the light curve was evenly sampled. The PSD from the FFT analysis is shown in Figure 3. We searched for QPO signals at frequencies f < 5 × 10⁻⁴ Hz, corresponding to periods greater than 2000 s. We chose this limit because the observed variability is dominated by measurement uncertainties at f > ∼5 × 10⁻⁴ Hz (see Figure 2). A QPO signal with the period of PQPO = 1.32 × 10⁴ s is detected, and the period was roughly consistent with our GP fitting result.
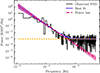 |
Fig. 2. Observed and best-fitting PSDs. The black curve shows the observed PSD estimated via the FFT method. The purple curve corresponds to the best-fitting model, which consists of a power law (red noise; the dashed pink line) and a constant (measurement noise; the dotted orange line). The shaded regions correspond to the 1σ confidence intervals. Note that the confidence interval for the measurement noise is too small to be visible. |
We used Monte Carlo simulations to assess the possibility (p-value) that the red noise could reproduce the observed (or even stronger) QPO signal. As a first step, we fit the FFT-based PSD with the following model, S(f) = A(f/(10−4 Hz))−β + C, where A and β are parameters characterizing the PSD of a red noise component, and C denotes the contribution due to measurement errors. We obtain the best-fitting values for these parameters by maximizing Whittle’s likelihood (Whittle 1953). The best-fitting parameters and their 1σ uncertainties are A = 1.40 ± 0.05, β = 3.07 ± 0.27, and C = (8.29 ± 0.39)×10−4, respectively. The uncertainties were estimated by resampling the observed PSD via bootstrapping. Note that the inferred β is steeper than the DRW PSD. The best-fitting PSD and its 1σ confidence interval are presented in Figure 2. Given that the confidence interval is rather small, we neglected it for further analysis. We then used the best-fitting red noise PSD to generate 5 × 10⁵ realizations of parent mock light curves following the methodology presented in Timmer & König (1995). To avoid red noise leakage effects, the parent mock light curves are 40 times longer and five times denser than the observed one. For each parent mock light curve, we used the linear interpolation to obtain a mock light curve whose cadence and duration are identical to the observed one. We also added white noise to match the signal-to-noise ratio of the observed XMM-Newton light curve. Then, we calculated the FFT-based PSD for each mock light curve following the same procedures applied to the observed one. The average of these 5 × 10⁵ mock PSDs, shown as the pink curve in Figure 3, provides a good fit to the overall shape of the observed PSD. The shaded regions in the figure correspond to the 3σ and 4σ confidence intervals of our 5 × 10⁵ mock PSDs. We concluded that the local p-value–defined as the probability of the noise model reproducing the observed (or even stronger) QPO signal specifically around PQPO = 1.32 × 10⁴ s–is less than 0.018%.
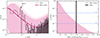 |
Fig. 3. Fast Fourier transform analysis of NGC 1566. Left: FFT PSD of the observed light curve with obs-ID 0800840201 (black curve). The pink curve is the average FFT PSD of the 5 × 10⁵ mock light curves (see text), and the shaded pink regions indicate its 3σ and 4σ confidence intervals. The QPO signal has a local p-value of 1.8 × 10⁻⁴ (3.6σ) for the period PQPO = 1.32 × 10⁴ s. Note that the y-axis is the product of the PSD and frequency. Right: Histogram (in pink) representing the global p-value (i.e., the survival function, accounting for the “look elsewhere” effect) derived from our red noise Monte Carlo simulations. The dashed blue lines indicate the 2σ and 3σ significance levels. The black line represents the observed QPO signal strength, resulting in a global p-value of 1.5 × 10⁻³ (i.e., 2.96σ). |
We had to also take into account the “look-elsewhere” effect and calculate the corresponding global p-value, as we had no strong prior constraint on the QPO period being around PQPO = 1.32 × 10⁴ s. As mentioned in Section 3, we restricted our search to frequencies f < 5 × 10⁻⁴ Hz, or periods greater than 2000 s. This choice was motivated by two reasons. First, the expected high-frequency QPO for NGC 1566, based on its SMBH mass, is 2000 ∼ 4000 s. Second, at frequencies higher than 5 × 10⁻⁴ Hz, the PSD is dominated by measurement noise. To identify potential QPO signals, we calculated the ratio of the observed PSD to the mean mock PSD. The QPO frequency is defined as the frequency that maximizes this ratio (hereafter, ρmax, obs). For each mock PSD, we likewise calculated its maximum ratio to the mean mock PSD (hereafter, ρmax, mock). The survival function of these 5 × 10⁵ρmax, mock is shown in the right panel of Figure 3. The vertical black line indicates ρmax, obs. The blue horizontal lines indicate the p-values for 2σ and 3σ confidence levels, respectively. The global p-value–the probability of the noise model reproducing the observed (or even stronger) QPO signal within the searched range of 105 s > PQPO > 2000 s–is simply the fraction of simulations where ρmax, mock ≥ ρmax, obs, i.e., 0.15%. This corresponds to a significance level of 2.96σ. We therefore identified an X-ray QPO candidate in the XMM-Newton obs-ID 0800840201 when NGC 1566 was in its 2018 outburst.
3. QPOs in NGC 1566 and other SMBH accreting systems
The QPO+DRW model can appropriately fit the rebinned XMM-Newton light curve of NGC 1566 (Figure 1). The best-fitting PSD has a prominent peak beyond the red noise, corresponding to a QPO period of  s (1σ). The combination of the two XMM-Newton observations also allows the red noise at low frequencies (≲10−5 Hz) to be well constrained. The Bayesian evidence for this model is ln(𝒵QPO + DRW) = − 2181.6. For comparison, we also fit the same XMM-Newton light curve with the aforementioned noise model (i.e., by artificially fixing PQPO to an extremely large value in Eq. 1), yielding ln(𝒵noise) = − 2196.5. Nearly identical Bayesian evidence is obtained when fitting with a standard DRW model. The natural logarithm of the Bayes factor between the QPO+DRW and noise models is therefore 14.9, indicating strong support for the presence of a QPO.
The measured QPO period for NGC 1566 can be compared with the high-frequency QPO scaling relation of BHXRBs. Using the SMBH mass compiled by Ochmann et al. (2024), the SMBH mass from the MBH-sigma relation is 4 ∼ 8 × 10⁶ M⊙. The high-frequency QPO scaling relation of BHXRBs (i.e., PQPO = (MBH/M⊙)/1862 s; see, e.g., Remillard & McClintock 2006; Zhou et al. 2015) predicts a high-frequency QPO period of 2148.2 ∼ 4296.4 s. The measured QPO period is a factor of roughly three to six times larger than this expected range. However, given the rather large uncertainties in MBH, we cannot rule out the possibility that the detected QPO candidate is an analog of high-frequency QPOs in BHXRBs.
We combined our result with previously reported X-ray AGN QPOs to construct a new QPO sample (Table 1). This sample is smaller than those compiled by Smith et al. (2021) or Zhang et al. (2025a) because we exclude sources that lack independent MBH measurements (i.e., those derived from methods other than the high-frequency QPO scaling relation) or whose QPOs were not in X-ray. We also include high-frequency QPOs in BHXRBs and other black hole systems. These sources can be classified as BHXRBs, TDEs, QPEs (quasi-periodic eruptions; e.g., Miniutti et al. 2019; Giustini et al. 2020), CL-AGNs, and NLS1s (see Table 1). Several sources with QPEs are also classified as TDEs because there is a strong connection between QPEs and TDEs (e.g., Nicholl et al. 2024). For instance, Jiang & Pan (2025) propose that QPEs are produced through collisions between a stellar-mass object (possibly formed in a prior AGN disk) and the newly formed misaligned TDE disk. Notably, BHXRBs often show different types of QPOs (for a review, see e.g., Remillard & McClintock 2006). As pointed out by Smith et al. (2021) and Zhang et al. (2025a), these QPOs in SMBH accretion systems2 are analogs of high-frequency QPOs in BHXRBs (e.g., Zhou et al. 2015).
Summary of X-ray QPO properties
4. Discussion
Our results in Section 3 suggest that QPOs in SMBH accretion systems are frequently detected in NLS1s or TDEs. Our following discussion is based on the assumption that high-frequency QPOs are indeed preferentially detected in these types of systems. As pointed out by Smith et al. (2021), this conclusion may suffer from selection biases. Specifically, most of the archival XMM-Newton observations were not optimized for QPO searches, and the observing conditions (e.g., exposure time and cadence) vary significantly among sources, which can significantly affect the QPO detection efficiency (e.g., Vaughan 2005). Nevertheless, as pointed out by Smith et al. (2021), González-Martín & Vaughan (2012) uniformly analyzed the X-ray variability of 104 AGNs with XMM-Newton observations and found the robust QPO signal only in RE J1034+396 (also see, e.g., Gierliński et al. 2008; Jin et al. 2021), which is an NLS1. Other QPO detections in AGNs from new data have also predominantly been in NLS1s. While NLS1s tend to have a smaller MBH (hence a shorter expected PQPO) than broad-line Seyfert 1s (BLS1s), some BLS1s with MBH < 107 M⊙ lack QPO detections (e.g., NGC 4593, NGC 7469, NGC 3227; see, González-Martín & Vaughan 2012). In addition, QPOs seem not to be uncommon in TDEs (e.g., Pasham et al. 2019; Masterson et al. 2025; Zhang et al. 2025b) with or without QPEs, with detections in over five sources among several dozen TDEs with high-quality X-ray observations (e.g., Gezari 2021). Hence, it appears that QPOs are often found in NLS1s or TDEs.
4.1. Physical implications of QPOs in TDEs and NLS1s
Both NLS1s and TDEs are characterized by high (peak) Eddington ratios (e.g., Williams et al. 2018; Gezari 2021), presumably resembling the SPL state of BHXRBs–the only spectral state in which high-frequency QPOs in BHXRBs are detected (e.g., Remillard & McClintock 2006; Belloni et al. 2012). Theoretically, a high Eddington ratio alone may not be a sufficient condition to drive high-frequency QPOs. As noted in Sect. 1, MHD simulations (e.g., Dewberry et al. 2020) have revealed that MHD turbulence can damp the g-mode oscillations (but see, Wagoner & Tandon 2021), a key process of the promising diskoseismology model for high-frequency QPOs. It has been demonstrated that misaligned and/or eccentric accretion flows can excite (e.g., Kato 2004; Ferreira & Ogilvie 2008; Henisey et al. 2009) and sustain the g-mode oscillations, thereby producing high-frequency QPOs (see, e.g., Dewberry et al. 2020; Musoke et al. 2023; Bollimpalli et al. 2024). Smith et al. (2021) mention that the fundamental g-mode oscillations cannot sufficiently account for the observed QPO frequencies, although this conclusion relies on the rather large uncertainties in SMBH mass estimations. In addition, misaligned accretion may also excite higher-order g-mode oscillations with larger frequencies than the fundamental one or p-mode waves that are responsible for the observed QPOs (e.g., Henisey et al. 2009). We therefore interpret our results with the assumption that the diskoseismology model is valid and that misaligned and/or eccentric accretion is required to drive discoseismic oscillations.
Misaligned and/or eccentric accretion is, in fact, a plausible scenario in TDEs because the newly formed accretion disk is often expected to be misaligned and/or eccentric (e.g., Rees 1988), as the orbit of the disrupted star is rarely initially aligned with the spin of the central SMBH. The alignment timescale between the SMBH and the misaligned and/or eccentric disk in a TDE can range from tens of days to several years, depending on the black hole spin, the accretion rate, the black-hole mass, and the viscosity parameter α (e.g., Franchini et al. 2016; Zanazzi & Lai 2019). For ASASSN-14li, the QPO signal is detectable for at least ∼450 days, which should be treated as a lower limit of the alignment timescale. Therefore, the SMBH spin cannot be near maximal (see Figure 12 of Zanazzi & Lai 2019) and the viscosity parameter α cannot be around unity (see Figure 10 of Franchini et al. 2016). In one Suzaku observation and in a series of XMM-Newon observations of Swift J164449.3+573451, a QPO signal is detected in the Suzaku and the first XMM-Newon observation. If the nondetection of the QPO in the subsequent XMM-Newon data is not caused by contamination from red noise or measurement error, the alignment timescale would be around 20 days. Given that the black hole mass of this source is likely much smaller than that of ASASSN-14li, the 20-day alignment timescale is possible. As for 2XMM J123103.2+110648, the XMM-Newton observations are too sparse to constrain the alignment timescale.
In AGNs, misaligned accretion disks can also form via mechanisms such as tilted gas inflows (e.g., Rees 1978; Volonteri et al. 2005), and randomly oriented accretion events on subparsec scales can readily power Seyfert galaxies (e.g., King & Pringle 2007). This leads to the question of why NLS1s might be particularly prone to having misaligned and/or eccentric accretion disks. We propose two possible explanations. First, misaligned accretion disks may be a distinctive feature of NLS1s, setting them apart from BLS1s. Theoretically, the misaligned accretion disk will eventually be aligned with the SMBH spin due to the Bardeen-Petterson effect (Bardeen & Petterson 1975). The timescale for this alignment (Scheuer & Feiler 1996) is ∼105–106 years for near-Eddington accretion (e.g., Natarajan & Pringle 1998; Volonteri et al. 2005). This youth scenario is supported by substantial evidence, including their characteristic properties such as a low MBH, a high λEdd, and distinct large-scale environments (Järvelä et al. 2017), which suggest that the current episode of black hole accretion was triggered recently (e.g., Mathur 2000). Therefore, NLS1s with QPOs could be young AGNs in which the accretion disks and SMBHs have not yet achieved alignment. Second, misaligned accretion disks may be common in AGNs, but only those with high Eddington ratios (e.g., NLS1s) can allow misalignment or eccentricity effects to propagate into the innermost regions. In summary, under the diskoseismology model, a misaligned accretion flow capable of inducing inertial oscillations in the innermost regions and driving high-frequency QPOs is plausible.
4.2. The fuelling mechanism of CL-AGNs
The detection of a QPO in NGC 1566 during its 2018 outburst has interesting implications for our understanding of CL-AGNs. As noted in Sect. 1, NGC 1566 reached an Eddington ratio of 6%∼12% in its 2018 outburst, and its optical spectra in the outburst show significant Fe II emission (Oknyansky et al. 2019). It is therefore reasonable to speculate that around the peak of the outburst, NGC 1566 reached a spectral state analogous to the SPL state in BHXRBs. Very recently, a QPO was also detected in another CL-AGN, 1ES 1927+654 (Masterson et al. 2025), with a large peak Eddington ratio of λEdd ≃ 1 (e.g., Li et al. 2024). This source has been interpreted as a TDE (e.g., Ricci et al. 2020) or a tilted gas inflow event, both of which imply a misalignment between the newly supplied gas and the SMBH spin. A QPO has been tentatively reported in the CL-AGN NGC 1365 (which shows absorption and accretion-rate variations; Jana et al. 2025) by Yan et al. (2024) but questioned by Gúrpide & Middleton (2025). Nevertheless, if the excitation mechanism of the QPO candidate in NGC 1556 is misaligned or eccentric accretion, our result supports the picture that the gas fuelling during its turn-on phase may be randomly orientated, potentially resulting in disks that are misaligned with the SMBHs and/or have a large eccentricity. Such a disk may precess and drive the possible “near-periodic” long-term X-ray fluctuations reported by Jana et al. (2021). The misalignment or eccentricity effects can propagate inward and induce inertial oscillations in the innermost regions, thereby producing the high-frequency QPOs observed in the light curve of obs-IDs 0800840201. For the other two XMM-Newton observations, the X-ray luminosity drops by a factor of about four (Table 7 in Jana et al. 2021) and the misalignment or eccentricity effects might be damped in low-λEdd cases. If QPOs are indeed more common in CL-AGNs than other AGNs, many CL events may be powered by misaligned or eccentric gas fuelling.
Substantial evidence suggests that QPEs are produced through collisions between a stellar-mass object (possibly formed in a prior AGN disk) and the newly formed misaligned and/or eccentric TDE disk (Xian et al. 2021; Franchini et al. 2023; Tagawa & Haiman 2023; Linial & Metzger 2023; Jiang & Pan 2025). In this scenario, QPEs serve as a reliable indicator of misaligned and/or eccentric gas fuelling (see also Lyu et al. 2026, who also allude to a similar idea). Interestingly, Hernández-García et al. (2025) reported QPEs in a newly discovered “turn-on” AGN, SDSS J133519.91 + 072807.4 (a.k.a., “Ansky”; but see Zhu et al. 2025, for the evidence of the alternative TDE possibility), suggesting the presence of misaligned accretion in the “turn-on” phase of this AGN. The same mechanism may also be responsible for powering CL-AGNs and creating a tearing disk to drive CL-AGN variability (e.g., Raj & Nixon 2021). We therefore speculate that, in CL-AGNs, a low angular momentum gas inflow supplies a misaligned and/or eccentric accretion disk. The interaction between the newly formed misaligned and/or eccentric accretion disk and the preexisting AGN disk can induce shocks, efficiently redistribute gas angular momentum, and greatly reduce the accretion timescale, thereby accounting for the short transition timescales in CL-AGNs. A critical question remains regarding where the gas that supplies the newly formed misaligned and/or eccentric accretion disks is in CL-AGN.
We propose that broad-line regions (BLRs) may act as the gas reservoir, supplying misaligned and eccentric fuel in CL-AGNs. This offers an alternative to models invoking chaotic accretion from much larger scales (Liu et al. 2021; Wang et al. 2024; Veronese et al. 2024), which must overcome the angular momentum barrier to effectively fuel the central SMBH. Krolik & Begelman (1988) proposed ∼1 M⊙ yr−1 inflows from dusty tori due to the cloud-cloud collisions. The dusty inflowing clouds may be responsible for BLRs (Wang et al. 2017). We speculate that a similar mechanism could operate within the BLR itself. Dynamical modeling of some AGNs, including the CL-AGN NGC 5548 (Pancoast et al. 2014), NGC 4151 (Ramachandran et al. 2025), and NGC 1566 (Ochmann et al. 2024), suggests that a fraction of BLR clouds can have eccentric orbits. While the eccentricity of most clouds is modest, it is quite possible that several clouds are highly eccentric and have a very low specific angular momentum. Furthermore, the proposed existence of spiral arms in BLRs (e.g., Du & Wang 2023) could channel misaligned gas inflows toward the SMBH, analogous to gaseous inflows in galactic disks (e.g., Kim & Elmegreen 2017). The BLR clouds with similar a low angular momentum may also manifest as “quasar rain” and produce X-ray eclipsing events (Elvis 2017), which have been observed in such CL-AGNs like NGC 3516, NGC 4151, and NGC 6814 (e.g., Kang et al. 2023; Lian et al. 2025). Recent numerical simulations have shown that low angular momentum gas accretion can have resonance around the horizon of the SMBH and generate QPOs (Dihingia & Mizuno 2025). Hence, CL-AGNs may be powered by the combination of a stable conventional accretion disk and a variable misaligned gas fuelling directly from BLRs.
At this point, another question is whether BLR clouds can provide sufficient accreting masses. Given that the critical λEdd for CL-AGNs is about 0.01 (e.g., Ricci & Trakhtenbrot 2023), the accreted mass during a typical CL-AGN flare can be estimated as ![Mathematical equation: $ M_{\mathrm{acc}}\sim 0.01\dot{M}_{\mathrm{Edd}}t_{\mathrm{dur}}\sim 0.02\ M_{\odot}(M_{\mathrm{BH}}/[10^8\ M_{\odot}])(t_{\mathrm{dur}}/[1\ \mathrm{yr}]) $](/articles/aa/full_html/2026/04/aa57983-25/aa57983-25-eq8.gif) , where
, where  is the Eddington accretion rate and tdur is the CL-AGN timescale. Note that the peak λEdd in CL-AGN outbursts (e.g., the 2018 outburst of NGC 1566) can be much higher than 1%. The mass of a typical BLR is ∼104 M⊙ (e.g., Baldwin et al. 2003), which is six orders of magnitude larger than Macc. The BLR is widely speculated to contain millions of BLR clouds (e.g., Arav et al. 1997). The typical velocity of a BLR cloud is close to the Kepler velocity
 ![Mathematical equation: $ v_{\mathrm{c}}\sim \sqrt{GM_{\mathrm{BH}}/R_{\mathrm{BLR}}}\sim 6.8\times 10^3\ \mathrm{km\ s^{-1}}(L_{5100}/[10^{43}\ \mathrm{erg\ s^{-1}}])^{-0.25}(M_{\mathrm{BH}}/[10^8\ M_{\odot}])^{0.5} $](/articles/aa/full_html/2026/04/aa57983-25/aa57983-25-eq10.gif) , where RBLR = 9.5 × 10⁻³ pc(L5100/[1043 erg s−1])0.5 is the BLR location (e.g., Bentz et al. 2009) and L5100 is the monochromatic luminosity at the rest-frame 5100 Å. The BLR sound speed is only cs ∼ 10 km s−1 because the gas temperature is Tc ∼ 104 K (e.g., Elvis 2017). One can estimate the typical size of a BLR cloud as Rc ≤ cs(2πRBLR/vc)≃3 × 1014 cm(L5100/[1043 erg s−1])0.25(λEdd/0.01)0.5, where λEdd ≃ 10L5100/LEdd with LEdd represents the Eddington luminosity. Given the typical BLR gas number density of nH ∼ 1011 cm−3 (e.g., Elvis 2017), the mass of a BLR cloud is Mc = 4πRc3nHmH/3 ≲ 0.009 M⊙(L5100/[1043 erg s−1])0.75(λEdd/0.01)1.5. Therefore, the infall of just Nf ∼ 1–10 clouds on extremely eccentric and misaligned orbits – possibly triggered by cloud collision interactions (Krolik & Begelman 1988), spiral arms (Du & Wang 2023), or condensation of disk winds (Elvis 2017) – could supply sufficient accretion energy to power the “turn-on” phase of a CL-AGN.
, where RBLR = 9.5 × 10⁻³ pc(L5100/[1043 erg s−1])0.5 is the BLR location (e.g., Bentz et al. 2009) and L5100 is the monochromatic luminosity at the rest-frame 5100 Å. The BLR sound speed is only cs ∼ 10 km s−1 because the gas temperature is Tc ∼ 104 K (e.g., Elvis 2017). One can estimate the typical size of a BLR cloud as Rc ≤ cs(2πRBLR/vc)≃3 × 1014 cm(L5100/[1043 erg s−1])0.25(λEdd/0.01)0.5, where λEdd ≃ 10L5100/LEdd with LEdd represents the Eddington luminosity. Given the typical BLR gas number density of nH ∼ 1011 cm−3 (e.g., Elvis 2017), the mass of a BLR cloud is Mc = 4πRc3nHmH/3 ≲ 0.009 M⊙(L5100/[1043 erg s−1])0.75(λEdd/0.01)1.5. Therefore, the infall of just Nf ∼ 1–10 clouds on extremely eccentric and misaligned orbits – possibly triggered by cloud collision interactions (Krolik & Begelman 1988), spiral arms (Du & Wang 2023), or condensation of disk winds (Elvis 2017) – could supply sufficient accretion energy to power the “turn-on” phase of a CL-AGN.
To produce UV/optical flares on the observed timescales, these clouds should reach tens of Schwarzschild radii and form a compact misaligned gas inflow. The BLR cloud will be significantly reshaped by the tidal force. In fact, the tidal force at the BLR is ∼GMBHMcRc/RBLR3 ≤ (πRc2)Pc, where Pc = nHmHcs2 is the gas pressure of the cloud. Unlike stars, the BLR clouds are not confined by self-gravity as their masses are smaller than the Jeans mass. Instead, a long-standing hypothesis is that BLR clouds are confined by external pressure, such as the background magnetic field with the strength of  (Rees 1987). At the BLR, the tidal force per unit area is close to the confinement pressure. As several clouds with low angular momentum fall into the SMBH, the tidal force will compress and stretch the clouds, and even break them into a number of extended filaments. If the angular momentum is sufficiently small, the trajectory is extremely eccentric with the periapsis (Rp) in order to be close to the SMBH. These bounded and stretched filaments may then collide, add gas to the preexisting disk, redistribute gas angular momentum, and rapidly fuel the SMBH after several orbits.
In our proposed scenario, the CL-AGN timescale is determined by the cloud inflow timescale. If the angular momentum is sufficiently small, the timescale is essentially the free-falling timescale from the BLR, i.e., ![Mathematical equation: $ \tau_{\mathrm{ff}}=\sqrt{R_{\mathrm{BLR}}^3/(GM_{\mathrm{BH}})}\simeq 1.4\ \mathrm{yr} (M_{\mathrm{BH}}/[10^8\ M_{\odot}])^{-0.5}(L_{5100}/[10^{43}\ \mathrm{erg\ s^{-1}}])^{0.75} = 1.5\ \mathrm{yr} (L_{5100}/[10^{43}\ \mathrm{erg\ s^{-1}}])^{0.25}(\lambda_{\mathrm{Edd}}/0.01)^{0.5} $](/articles/aa/full_html/2026/04/aa57983-25/aa57983-25-eq12.gif) . This timescale is insensitive to L5100 or MBH for fixed λEdd and is much shorter than the viscous timescale of an extended, conventional disk around the SMBH. Hence, it can reconcile with the observed CL timescale and its lack of dependence on AGN properties (e.g., Wang et al. 2024). Moreover, our proposed gas fuelling mechanism should play a minor role in high Eddington-ratio AGNs because the corresponding mass accretion rate of the conventional accretion disk would be large. This may explain why CL-AGNs have λEdd ∼ 0.01 because our proposed gas fuelling can ignite SMBH activities with the accretion rate of
. This timescale is insensitive to L5100 or MBH for fixed λEdd and is much shorter than the viscous timescale of an extended, conventional disk around the SMBH. Hence, it can reconcile with the observed CL timescale and its lack of dependence on AGN properties (e.g., Wang et al. 2024). Moreover, our proposed gas fuelling mechanism should play a minor role in high Eddington-ratio AGNs because the corresponding mass accretion rate of the conventional accretion disk would be large. This may explain why CL-AGNs have λEdd ∼ 0.01 because our proposed gas fuelling can ignite SMBH activities with the accretion rate of ![Mathematical equation: $ {\sim} M_{\mathrm{c}}/\tau_{\mathrm{ff}}\sim 0.02\dot{M}_{\mathrm{Edd}} (N_{\mathrm{f}}/10)(M_{\mathrm{BH}}/[10^8\ M_{\odot}])^{-1}(L_{5100}/[10^{43}\ \mathrm{erg\ s^{-1}}])^{1.5} $](/articles/aa/full_html/2026/04/aa57983-25/aa57983-25-eq13.gif) .
.
5. Summary
In this work, we have searched for the QPO signal in the low-mass CL-AGN NGC 1566. Our results are summarized as follows.
-
We detected a QPO candidate with the period
 in the 2018 outburst of NGC 1566. This X-ray QPO likely represents an analog of the high-frequency QPOs in BHXRBs.
 -
The AGN X-ray QPOs are only found in NLS1s, QPEs, TDEs, and (now) in the CL-AGN NGC 1566. We speculate that the high-detection rate of QPOs in NLS1s can be understood if NLS1s are young AGNs and the accretion disk has not yet been aligned with the SMBH, similar to the newly formed accretion disks in TDEs.
-
The QPO detection in NGC 1566 suggests that the gas fuelling in CL-AGNs may be misaligned and extremely eccentric BLR clouds. Such gas can form a compact accretion disk around the SMBH. The scenario can also easily explain the CL-AGN timescale, which is about two orders of magnitude smaller than the viscous timescale of a standard accretion disk model.
Future X-ray timing observations of NLS1s and CL-AGNs can verify our scenario by testing the following prediction: QPOs (and potentially QPEs) should be detectable in CL-AGNs and young NLS1s, provided these signals are not diluted by red noise. Alternatively, microlensing of CL-AGNs can probe the accretion-disk sizes and test our proposed misaligned gas fuelling scenario, which involves a misaligned compact accretion disk.
Acknowledgments
We thank Du Pu and Min Du for the discussion of spiral arms in broad-line regions and Wenjuan Liu for the inflows in AGN, Shanshan Weng for extracting the NuSTAR data, and the referee for useful comments that improved this manuscript. M.Y.S. and S.Y.Z. acknowledge support from the National Natural Science Foundation of China (NSFC-12322303), the National Key R&D Program of China (No. 2023YFA1607903), and the Fundamental Research Funds for the Central Universities (20720240152). J.F.W. acknowledges support from the National Natural Science Foundation of China (NSFC-12221003) and the National Key R&D Program of China (No. 2023YFA1607904). Y.Q.X. acknowledges support from the National Natural Science Foundation of China (NSFC-12025303). This manuscript benefited from grammar checking by DeepSeek and Grammarly. We acknowledge the use of the XMM-Newton Science Archive (XSA) and the SAS software.
References
- Abramowicz, M. A., & Kluźniak, W. 2001, A&A, 374, L19 [NASA ADS] [CrossRef] [EDP Sciences] [Google Scholar]
- Alloin, D., Pelat, D., Phillips, M. M., Fosbury, R. A. E., & Freeman, K. 1986, ApJ, 308, 23 [NASA ADS] [CrossRef] [Google Scholar]
- Alston, W. N., Parker, M. L., Markevičiūtė, J., et al. 2015, MNRAS, 449, 467 [CrossRef] [Google Scholar]
- Antonucci, R. 2013, Nature, 495, 165 [Google Scholar]
- Arav, N., Barlow, T. A., Laor, A., & Blandford, R. D. 1997, MNRAS, 288, 1015 [NASA ADS] [CrossRef] [Google Scholar]
- Balbus, S. A., & Hawley, J. F. 1998, Rev. Mod. Phys., 70, 1 [Google Scholar]
- Baldwin, J. A., Ferland, G. J., Korista, K. T., Hamann, F., & Dietrich, M. 2003, ApJ, 582, 590 [NASA ADS] [CrossRef] [Google Scholar]
- Bardeen, J. M., & Petterson, J. A. 1975, ApJ, 195, L65 [Google Scholar]
- Belloni, T. M., Sanna, A., & Méndez, M. 2012, MNRAS, 426, 1701 [NASA ADS] [CrossRef] [Google Scholar]
- Bentz, M. C., & Katz, S. 2015, PASP, 127, 67 [Google Scholar]
- Bentz, M. C., Peterson, B. M., Netzer, H., Pogge, R. W., & Vestergaard, M. 2009, ApJ, 697, 160 [Google Scholar]
- Blandford, R. D., & McKee, C. F. 1982, ApJ, 255, 419 [Google Scholar]
- Bollimpalli, D. A., Fragile, P. C., Dewberry, J. W., & Kluźniak, W. 2024, MNRAS, 528, 1142 [Google Scholar]
- Cackett, E. M., Bentz, M. C., & Kara, E. 2021, Science, 24, 102557 [NASA ADS] [Google Scholar]
- Carpano, S., & Jin, C. 2018, MNRAS, 477, 3178 [NASA ADS] [CrossRef] [Google Scholar]
- Cui, W., Shrader, C. R., Haswell, C. A., & Hynes, R. I. 2000, ApJ, 535, L123 [Google Scholar]
- Czerny, B., You, B., Kurcz, A., et al. 2016, A&A, 594, A102 [NASA ADS] [CrossRef] [EDP Sciences] [Google Scholar]
- Dewberry, J. W., Latter, H. N., Ogilvie, G. I., & Fromang, S. 2020, MNRAS, 497, 451 [NASA ADS] [CrossRef] [Google Scholar]
- Dexter, J., & Begelman, M. C. 2019, MNRAS, 483, L17 [NASA ADS] [CrossRef] [Google Scholar]
- Dihingia, I. K., & Mizuno, Y. 2025, ApJ, 982, L21 [Google Scholar]
- Dong, Q., Zhang, Z.-X., Gu, W.-M., Sun, M., & Zheng, Y.-G. 2025, ApJ, 986, 160 [Google Scholar]
- Du, P., & Wang, J.-M. 2023, A&A, 671, A26 [NASA ADS] [CrossRef] [EDP Sciences] [Google Scholar]
- Elvis, M. 2017, ApJ, 847, 56 [NASA ADS] [CrossRef] [Google Scholar]
- Fazeli, N., Busch, G., Valencia, S. M., et al. 2019, A&A, 622, A128 [NASA ADS] [CrossRef] [EDP Sciences] [Google Scholar]
- Feng, J., Cao, X., Li, J.-W., & Gu, W.-M. 2021, ApJ, 916, 61 [NASA ADS] [CrossRef] [Google Scholar]
- Ferreira, B. T., & Ogilvie, G. I. 2008, MNRAS, 386, 2297 [Google Scholar]
- Foreman-Mackey, D., Agol, E., Ambikasaran, S., & Angus, R. 2017, AJ, 154, 220 [Google Scholar]
- Foster, G. 1996, AJ, 112, 1709 [NASA ADS] [CrossRef] [Google Scholar]
- Franchini, A., Lodato, G., & Facchini, S. 2016, MNRAS, 455, 1946 [NASA ADS] [CrossRef] [Google Scholar]
- Franchini, A., Bonetti, M., Lupi, A., et al. 2023, A&A, 675, A100 [NASA ADS] [CrossRef] [EDP Sciences] [Google Scholar]
- Gezari, S. 2021, ARA&A, 59, 21 [NASA ADS] [CrossRef] [Google Scholar]
- Gierliński, M., Middleton, M., Ward, M., & Done, C. 2008, Nature, 455, 369 [CrossRef] [Google Scholar]
- Giustini, M., Miniutti, G., & Saxton, R. D. 2020, A&A, 636, L2 [NASA ADS] [CrossRef] [EDP Sciences] [Google Scholar]
- González-Martín, O., & Vaughan, S. 2012, A&A, 544, A80 [NASA ADS] [CrossRef] [EDP Sciences] [Google Scholar]
- Greene, J., Bailyn, C. D., & Orosz, J. A. 2001, ApJ, 554, 1290 [NASA ADS] [CrossRef] [Google Scholar]
- Grupe, D., Komossa, S., Leighly, K. M., & Page, K. L. 2010, ApJS, 187, 64 [NASA ADS] [CrossRef] [Google Scholar]
- Guo, H., Sun, M., Liu, X., et al. 2019, ApJ, 883, L44 [Google Scholar]
- Guo, W.-J., Zou, H., Fawcett, V. A., et al. 2024, ApJS, 270, 26 [NASA ADS] [CrossRef] [Google Scholar]
- Gupta, A. C., Tripathi, A., Wiita, P. J., et al. 2018, A&A, 616, L6 [NASA ADS] [CrossRef] [EDP Sciences] [Google Scholar]
- Gúrpide, A., & Middleton, M. 2025, MNRAS, 537, 3210 [Google Scholar]
- Henisey, K. B., Blaes, O. M., Fragile, P. C., & Ferreira, B. T. 2009, ApJ, 706, 705 [Google Scholar]
- Hernández-García, L., Chakraborty, J., Sánchez-Sáez, P., et al. 2025, Nat. Astron., 9, 895 [Google Scholar]
- Ho, L. C., Kim, M., & Terashima, Y. 2012, ApJ, 759, L16 [NASA ADS] [CrossRef] [Google Scholar]
- Homan, J., Klein-Wolt, M., Rossi, S., et al. 2003, ApJ, 586, 1262 [NASA ADS] [CrossRef] [Google Scholar]
- Homan, J., Miller, J. M., Wijnands, R., et al. 2005, ApJ, 623, 383 [Google Scholar]
- Hübner, M., Huppenkothen, D., Lasky, P. D., & Inglis, A. R. 2022a, ApJS, 259, 32 [NASA ADS] [CrossRef] [Google Scholar]
- Hübner, M., Huppenkothen, D., Lasky, P. D., et al. 2022b, ApJ, 936, 17 [Google Scholar]
- Ingram, A. R., & Motta, S. E. 2019, New Astron. Rev., 85, 101524 [Google Scholar]
- Jana, A., Kumari, N., Nandi, P., et al. 2021, MNRAS, 507, 687 [NASA ADS] [CrossRef] [Google Scholar]
- Jana, A., Ricci, C., Temple, M. J., et al. 2025, A&A, 693, A35 [NASA ADS] [CrossRef] [EDP Sciences] [Google Scholar]
- Järvelä, E., Lähteenmäki, A., Lietzen, H., et al. 2017, A&A, 606, A9 [NASA ADS] [CrossRef] [EDP Sciences] [Google Scholar]
- Jiang, N., & Pan, Z. 2025, ApJ, 983, L18 [Google Scholar]
- Jin, C., Done, C., & Ward, M. 2021, MNRAS, 500, 2475 [Google Scholar]
- Kang, J.-L., Wang, J.-X., & Fu, S.-Q. 2023, MNRAS, 525, 1941 [NASA ADS] [CrossRef] [Google Scholar]
- Kasliwal, V. P., Vogeley, M. S., & Richards, G. T. 2015, MNRAS, 451, 4328 [CrossRef] [Google Scholar]
- Kass, R. E., & Raftery, A. E. 1995, J. Am. Statist. Assoc., 90, 773 [CrossRef] [Google Scholar]
- Kato, S. 2004, PASJ, 56, 905 [NASA ADS] [Google Scholar]
- Kato, S., Fukue, J., & Mineshige, S. 2008, Black-Hole Accretion Disks - Towards a New Paradigm (Kyoto: Kyoto Univ. Press) [Google Scholar]
- Kelly, B. C., Bechtold, J., & Siemiginowska, A. 2009, ApJ, 698, 895 [Google Scholar]
- Kim, W.-T., & Elmegreen, B. G. 2017, ApJ, 841, L4 [NASA ADS] [CrossRef] [Google Scholar]
- King, A. R., & Pringle, J. E. 2007, MNRAS, 377, L25 [CrossRef] [Google Scholar]
- Koss, M. J., Ricci, C., Trakhtenbrot, B., et al. 2022, ApJS, 261, 2 [NASA ADS] [CrossRef] [Google Scholar]
- Krolik, J. H., & Begelman, M. C. 1988, ApJ, 329, 702 [Google Scholar]
- Lawrence, A. 2018, Nat. Astron., 2, 102 [NASA ADS] [CrossRef] [Google Scholar]
- Li, L.-X., & Narayan, R. 2004, ApJ, 601, 414 [Google Scholar]
- Li, R., Ho, L. C., Ricci, C., et al. 2022, ApJ, 933, 70 [NASA ADS] [CrossRef] [Google Scholar]
- Li, R., Ricci, C., Ho, L. C., et al. 2024, ApJ, 975, 140 [NASA ADS] [CrossRef] [Google Scholar]
- Lian, T., Jin, C., & Yuan, W. 2025, ApJ, 986, 222 [Google Scholar]
- Lin, D., Irwin, J. A., Godet, O., Webb, N. A., & Barret, D. 2013, ApJ, 776, L10 [NASA ADS] [CrossRef] [Google Scholar]
- Linial, I., & Metzger, B. D. 2023, ApJ, 957, 34 [NASA ADS] [CrossRef] [Google Scholar]
- Liu, W.-J., Lira, P., Yao, S., et al. 2021, ApJ, 915, 63 [NASA ADS] [CrossRef] [Google Scholar]
- Lyu, Z., Pan, Z., Mao, J., Jiang, N., & Yang, H. 2026, Phys. Rev. D, 113, 043002 [Google Scholar]
- Ma, Q.-Q., Gu, W.-M., Cai, Z.-Y., et al. 2025, ApJ, 985, 185 [Google Scholar]
- MacLeod, C. L., Ross, N. P., Lawrence, A., et al. 2016, MNRAS, 457, 389 [Google Scholar]
- Massi, M. 2011, Mem. Soc. Astron. It., 82, 24 [Google Scholar]
- Masterson, M., Kara, E., Panagiotou, C., et al. 2025, Nature, 638, 370 [Google Scholar]
- Mathur, S. 2000, MNRAS, 314, L17 [NASA ADS] [CrossRef] [Google Scholar]
- Mïller, J. M., & Gültekin, K. 2011, ApJ, 738, L13 [Google Scholar]
- Miniutti, G., Saxton, R. D., Giustini, M., et al. 2019, Nature, 573, 381 [Google Scholar]
- Miniutti, G., Giustini, M., Arcodia, R., et al. 2023, A&A, 670, A93 [NASA ADS] [CrossRef] [EDP Sciences] [Google Scholar]
- Musoke, G., Liska, M., Porth, O., van der Klis, M., & Ingram, A. 2023, MNRAS, 518, 1656 [Google Scholar]
- Natarajan, P., & Pringle, J. E. 1998, ApJ, 506, L97 [NASA ADS] [CrossRef] [Google Scholar]
- Nathan, E., Ingram, A., Steiner, J. F., et al. 2024, MNRAS, 533, 2441 [Google Scholar]
- Nicholl, M., Pasham, D. R., Mummery, A., et al. 2024, Nature, 634, 804 [CrossRef] [Google Scholar]
- Noble, S. C., & Krolik, J. H. 2009, ApJ, 703, 964 [NASA ADS] [CrossRef] [Google Scholar]
- Ochmann, M. W., Kollatschny, W., Probst, M. A., et al. 2024, A&A, 686, A17 [NASA ADS] [CrossRef] [EDP Sciences] [Google Scholar]
- Oknyansky, V. L., Winkler, H., Tsygankov, S. S., et al. 2019, MNRAS, 483, 558 [NASA ADS] [CrossRef] [Google Scholar]
- Orosz, J. A., McClintock, J. E., Remillard, R. A., & Corbel, S. 2004, ApJ, 616, 376 [NASA ADS] [CrossRef] [Google Scholar]
- Orosz, J. A., Steiner, J. F., McClintock, J. E., et al. 2011, ApJ, 730, 75 [NASA ADS] [CrossRef] [Google Scholar]
- Pan, H.-W., Yuan, W., Yao, S., et al. 2016, ApJ, 819, L19 [NASA ADS] [CrossRef] [Google Scholar]
- Pancoast, A., Brewer, B. J., Treu, T., et al. 2014, MNRAS, 445, 3073 [Google Scholar]
- Papadakis, I. E. 2004, MNRAS, 348, 207 [NASA ADS] [CrossRef] [Google Scholar]
- Pasham, D. R., Strohmayer, T. E., & Mushotzky, R. F. 2014, Nature, 513, 74 [Google Scholar]
- Pasham, D. R., Remillard, R. A., Fragile, P. C., et al. 2019, Science, 363, 531 [NASA ADS] [CrossRef] [Google Scholar]
- Pasham, D. R., Zajaček, M., Nixon, C. J., et al. 2024, Nature, 630, 325 [NASA ADS] [CrossRef] [Google Scholar]
- Raj, A., & Nixon, C. J. 2021, ApJ, 909, 82 [NASA ADS] [CrossRef] [Google Scholar]
- Ramachandran, M., Robinson, J. H., Bentz, M. C., et al. 2025, ASP Conf. Ser., 540, 9 [Google Scholar]
- Rees, M. J. 1978, Nature, 275, 516 [NASA ADS] [CrossRef] [Google Scholar]
- Rees, M. J. 1987, MNRAS, 228, 47P [NASA ADS] [CrossRef] [Google Scholar]
- Rees, M. J. 1988, Nature, 333, 523 [Google Scholar]
- Reid, M. J., McClintock, J. E., Steiner, J. F., et al. 2014, ApJ, 796, 2 [Google Scholar]
- Reis, R. C., Miller, J. M., Reynolds, M. T., et al. 2012, Science, 337, 949 [NASA ADS] [CrossRef] [Google Scholar]
- Remillard, R. A. 2004, Am. Inst. Phys. Conf. Ser., 714, 13 [Google Scholar]
- Remillard, R. A., & McClintock, J. E. 2006, ARA&A, 44, 49 [Google Scholar]
- Remillard, R. A., Muno, M. P., McClintock, J. E., & Orosz, J. A. 2002, ApJ, 580, 1030 [NASA ADS] [CrossRef] [Google Scholar]
- Ricci, C., & Trakhtenbrot, B. 2023, Nat. Astron., 7, 1282 [Google Scholar]
- Ricci, C., Kara, E., Loewenstein, M., et al. 2020, ApJ, 898, L1 [Google Scholar]
- Scargle, J. D. 1982, ApJ, 263, 835 [Google Scholar]
- Scheuer, P. A. G., & Feiler, R. 1996, MNRAS, 282, 291 [NASA ADS] [CrossRef] [Google Scholar]
- Shakura, N. I., & Sunyaev, R. A. 1973, A&A, 24, 337 [NASA ADS] [Google Scholar]
- Smith, K. L., Tandon, C. R., & Wagoner, R. V. 2021, ApJ, 906, 92 [NASA ADS] [CrossRef] [Google Scholar]
- Sniegowska, M., Czerny, B., Bon, E., & Bon, N. 2020, A&A, 641, A167 [NASA ADS] [CrossRef] [EDP Sciences] [Google Scholar]
- Song, J. R., Shu, X. W., Sun, L. M., et al. 2020, A&A, 644, L9 [NASA ADS] [CrossRef] [EDP Sciences] [Google Scholar]
- Stella, L., Vietri, M., & Morsink, S. M. 1999, ApJ, 524, L63 [CrossRef] [Google Scholar]
- Strohmayer, T. E., Mushotzky, R. F., Winter, L., et al. 2007, ApJ, 660, 580 [NASA ADS] [CrossRef] [Google Scholar]
- Sun, M., Xue, Y., Brandt, W. N., et al. 2020, ApJ, 891, 178 [CrossRef] [Google Scholar]
- Tagawa, H., & Haiman, Z. 2023, MNRAS, 526, 69 [NASA ADS] [CrossRef] [Google Scholar]
- Timmer, J., & König, M. 1995, A&A, 300, 707 [Google Scholar]
- Vaughan, S. 2005, A&A, 431, 391 [NASA ADS] [CrossRef] [EDP Sciences] [Google Scholar]
- Vaughan, S. 2013, Philos. Trans. R. Soc. A Math. Phys. Eng. Sci., 371, 20110549 [Google Scholar]
- Veronese, S., Vignali, C., Severgnini, P., Matzeu, G. A., & Cignoni, M. 2024, A&A, 683, A131 [NASA ADS] [CrossRef] [EDP Sciences] [Google Scholar]
- Volonteri, M., Madau, P., Quataert, E., & Rees, M. J. 2005, ApJ, 620, 69 [NASA ADS] [CrossRef] [Google Scholar]
- Wagoner, R. V., & Tandon, C. R. 2021, Res. Notes Am. Astron. Soc., 5, 274 [Google Scholar]
- Wang, J.-M., Du, P., Brotherton, M. S., et al. 2017, Nat. Astron., 1, 775 [NASA ADS] [CrossRef] [Google Scholar]
- Wang, J., Xu, D. W., Cao, X., et al. 2024, ApJ, 970, 85 [NASA ADS] [CrossRef] [Google Scholar]
- Wang, Y., Lin, Z., Wu, L., et al. 2025, Sci. Adv., 11, 25.9068 [Google Scholar]
- Wevers, T., van Velzen, S., Jonker, P. G., et al. 2017, MNRAS, 471, 1694 [NASA ADS] [CrossRef] [Google Scholar]
- Whittle, P. 1953, Arkiv for Matematik, 2, 423 [Google Scholar]
- Williams, J. K., Gliozzi, M., & Rudzinsky, R. V. 2018, MNRAS, 480, 96 [NASA ADS] [CrossRef] [Google Scholar]
- Xia, R., Liu, H., & Xue, Y. 2024, ApJ, 961, L32 [Google Scholar]
- Xia, R., Liu, H., & Xue, Y. 2025, ApJ, 983, 13 [Google Scholar]
- Xian, J., Zhang, F., Dou, L., He, J., & Shu, X. 2021, ApJ, 921, L32 [NASA ADS] [CrossRef] [Google Scholar]
- Xu, D. W., Komossa, S., Grupe, D., et al. 2024, Universe, 10, 61 [NASA ADS] [CrossRef] [Google Scholar]
- Yan, Y. K., Zhang, P., Liu, Q. Z., et al. 2024, A&A, 691, A7 [NASA ADS] [CrossRef] [EDP Sciences] [Google Scholar]
- Yanes-Rizo, I. V., Torres, M. A. P., Casares, J., et al. 2022, MNRAS, 517, 1476 [NASA ADS] [CrossRef] [Google Scholar]
- You, B., Bursa, M., & Życki, P. T. 2018, ApJ, 858, 82 [Google Scholar]
- Yu, W., Richards, G. T., Vogeley, M. S., Moreno, J., & Graham, M. J. 2022, ApJ, 936, 132 [NASA ADS] [CrossRef] [Google Scholar]
- Zanazzi, J. J., & Lai, D. 2019, MNRAS, 487, 4965 [NASA ADS] [CrossRef] [Google Scholar]
- Zhang, P., Zhang, P.-F., Yan, J.-Z., Fan, Y.-Z., & Liu, Q.-Z. 2017, ApJ, 849, 9 [CrossRef] [Google Scholar]
- Zhang, H., Yang, S., & Dai, B. 2023, ApJ, 946, 52 [Google Scholar]
- Zhang, H., Meng, L., Zhang, L., & Dai, B. 2025a, MNRAS, 538, 2161 [Google Scholar]
- Zhang, W., Shu, X., Sun, L., et al. 2025b, Nat. Astron., 9, 702 [Google Scholar]
- Zhou, X.-L., Yuan, W., Pan, H.-W., & Liu, Z. 2015, ApJ, 798, L5 [Google Scholar]
- Zhu, X.-J., & Thrane, E. 2020, ApJ, 900, 117 [NASA ADS] [CrossRef] [Google Scholar]
- Zhu, J., Jiang, N., Wang, Y., et al. 2025, ApJ, 994, L16 [Google Scholar]
For the code implementation, see https://github.com/MoritzThomasHuebner/QPOEstimation
However, possible exceptions include 2XMM 123103.2+110648 (which is claimed to be a low-frequency QPO analog; see Lin et al. 2013) and GSN 069.
All Tables
All Figures
|
Fig. 1. Gaussian process fitting results of the QPO+DRW model for NGC 1566. Top left: Background-subtracted XMM-Newton EPIC light curve of NGC 1566 in the 0.2–10 keV band (black dots with error bars), binned at 100 s. The light curve corresponds to the obs-ID 0800840201, for which NGC 1566 was in the outburst phase. The green curves represent the long-term trend modeled by a shewed Gaussian function, which describes the outburst profile well. The yellow curve is the sum of the best-fitting QPO+DRW model and the trend. Top right: Same as the top-left panel, but with the long-term trend (i.e., the green curve in the top panel) subtracted. Bottom left: Posterior distribution of the QPO period yielding |
| In the text | |
|
Fig. 2. Observed and best-fitting PSDs. The black curve shows the observed PSD estimated via the FFT method. The purple curve corresponds to the best-fitting model, which consists of a power law (red noise; the dashed pink line) and a constant (measurement noise; the dotted orange line). The shaded regions correspond to the 1σ confidence intervals. Note that the confidence interval for the measurement noise is too small to be visible. |
| In the text | |
|
Fig. 3. Fast Fourier transform analysis of NGC 1566. Left: FFT PSD of the observed light curve with obs-ID 0800840201 (black curve). The pink curve is the average FFT PSD of the 5 × 10⁵ mock light curves (see text), and the shaded pink regions indicate its 3σ and 4σ confidence intervals. The QPO signal has a local p-value of 1.8 × 10⁻⁴ (3.6σ) for the period PQPO = 1.32 × 10⁴ s. Note that the y-axis is the product of the PSD and frequency. Right: Histogram (in pink) representing the global p-value (i.e., the survival function, accounting for the “look elsewhere” effect) derived from our red noise Monte Carlo simulations. The dashed blue lines indicate the 2σ and 3σ significance levels. The black line represents the observed QPO signal strength, resulting in a global p-value of 1.5 × 10⁻³ (i.e., 2.96σ). |
| In the text | |
Current usage metrics show cumulative count of Article Views (full-text article views including HTML views, PDF and ePub downloads, according to the available data) and Abstracts Views on Vision4Press platform.
Data correspond to usage on the plateform after 2015. The current usage metrics is available 48-96 hours after online publication and is updated daily on week days.
Initial download of the metrics may take a while.