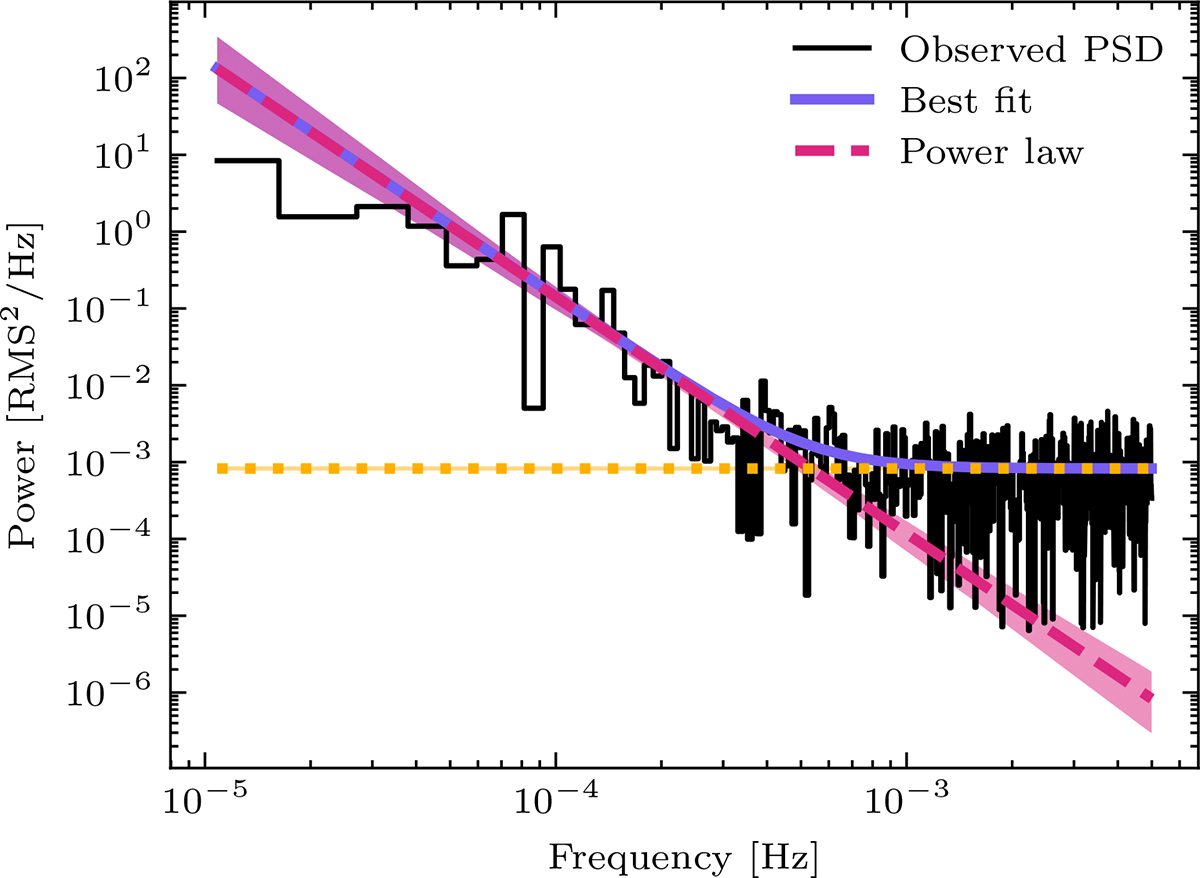
Fig. 2.
Download original image
Observed and best-fitting PSDs. The black curve shows the observed PSD estimated via the FFT method. The purple curve corresponds to the best-fitting model, which consists of a power law (red noise; the dashed pink line) and a constant (measurement noise; the dotted orange line). The shaded regions correspond to the 1σ confidence intervals. Note that the confidence interval for the measurement noise is too small to be visible.
Current usage metrics show cumulative count of Article Views (full-text article views including HTML views, PDF and ePub downloads, according to the available data) and Abstracts Views on Vision4Press platform.
Data correspond to usage on the plateform after 2015. The current usage metrics is available 48-96 hours after online publication and is updated daily on week days.
Initial download of the metrics may take a while.