Fig. 3.
Download original image
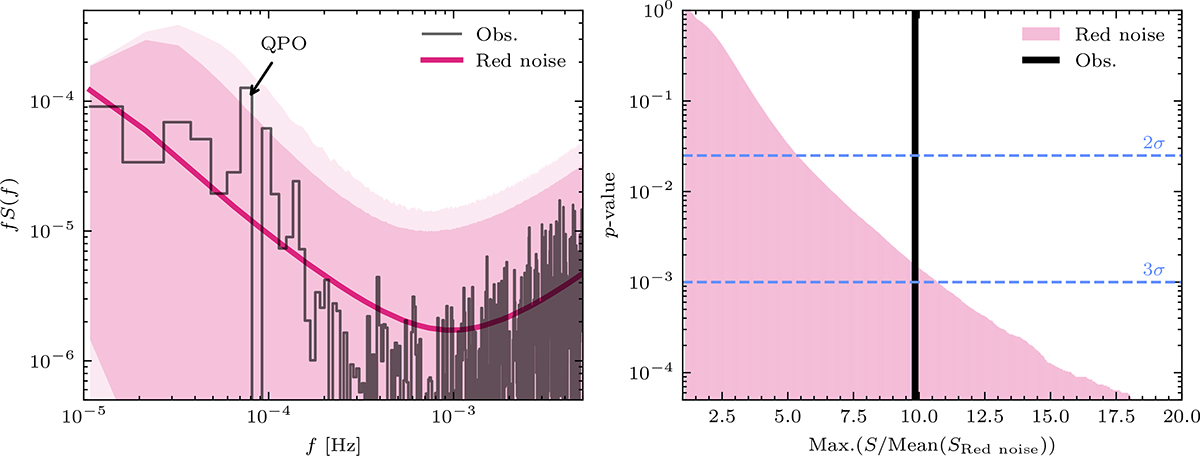
Fast Fourier transform analysis of NGC 1566. Left: FFT PSD of the observed light curve with obs-ID 0800840201 (black curve). The pink curve is the average FFT PSD of the 5 × 10⁵ mock light curves (see text), and the shaded pink regions indicate its 3σ and 4σ confidence intervals. The QPO signal has a local p-value of 1.8 × 10⁻⁴ (3.6σ) for the period PQPO = 1.32 × 10⁴ s. Note that the y-axis is the product of the PSD and frequency. Right: Histogram (in pink) representing the global p-value (i.e., the survival function, accounting for the “look elsewhere” effect) derived from our red noise Monte Carlo simulations. The dashed blue lines indicate the 2σ and 3σ significance levels. The black line represents the observed QPO signal strength, resulting in a global p-value of 1.5 × 10⁻³ (i.e., 2.96σ).
Current usage metrics show cumulative count of Article Views (full-text article views including HTML views, PDF and ePub downloads, according to the available data) and Abstracts Views on Vision4Press platform.
Data correspond to usage on the plateform after 2015. The current usage metrics is available 48-96 hours after online publication and is updated daily on week days.
Initial download of the metrics may take a while.