Fig. 10.
Download original image
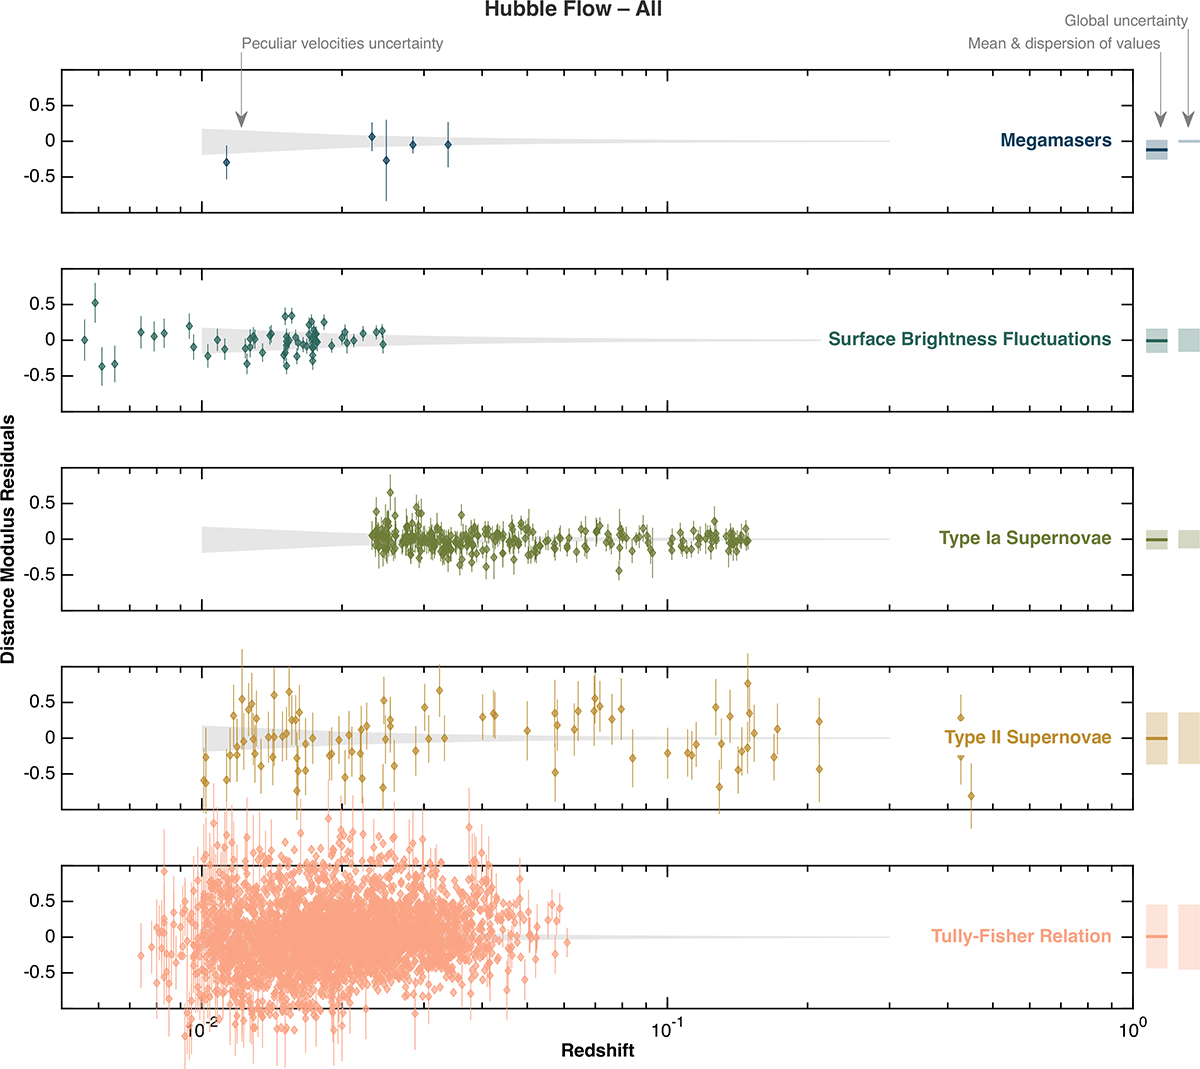
Residuals in log(H0) versus redshift for objects in the Hubble flow for the “everything” solution. Each subplot refers to sources in the same group, measured by the same method. Error bars for individual sources are representative of the expected scatter across sources in the same category and do not include calibration uncertainties for each class. The shaded bars at the right show the mean and dispersion for each category.
Current usage metrics show cumulative count of Article Views (full-text article views including HTML views, PDF and ePub downloads, according to the available data) and Abstracts Views on Vision4Press platform.
Data correspond to usage on the plateform after 2015. The current usage metrics is available 48-96 hours after online publication and is updated daily on week days.
Initial download of the metrics may take a while.