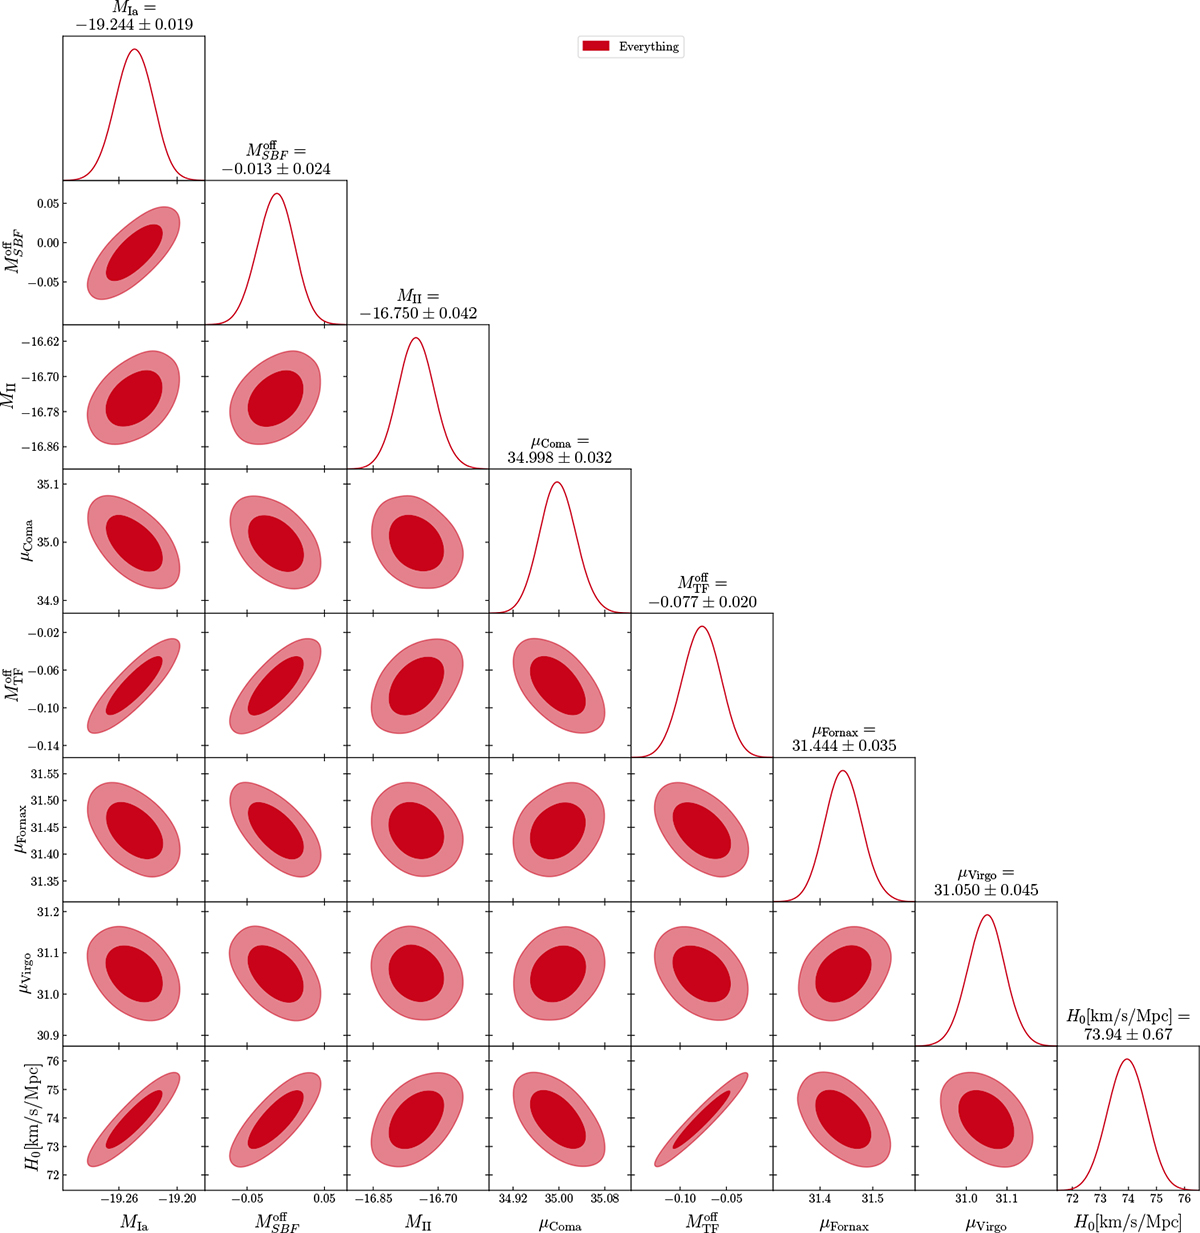
Fig. 11.
Download original image
Corner plot illustrating the main optimization parameters for the all-inclusive solution. The naming convention of Appendix B.3.1 is used. Parameters related to individual host distances are not included. Note that this solution is not an alternative result to the baseline solution, but rather it is a variant to check the impact of further data on our result (see also Sect. 5). We show it here to highlight the existing correlations between the various (most important) solution parameters. Deviations from the analytically calculated result are due to the numerical precision of a finite-length chain.
Current usage metrics show cumulative count of Article Views (full-text article views including HTML views, PDF and ePub downloads, according to the available data) and Abstracts Views on Vision4Press platform.
Data correspond to usage on the plateform after 2015. The current usage metrics is available 48-96 hours after online publication and is updated daily on week days.
Initial download of the metrics may take a while.