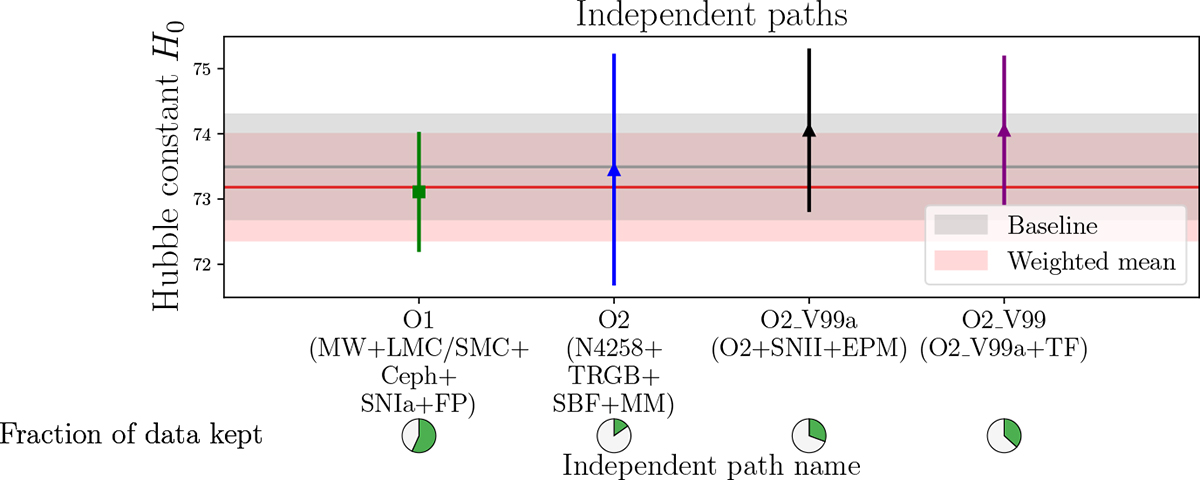
Fig. 12.
Download original image
Illustration of H0 estimates resulting from orthogonal paths. The two paths starting with “O” are proper orthogonal paths and can be taken as independent measurements of the Hubble constant. Their weighted mean (red) agrees well with our baseline result despite the latter including all cross-correlations. The shortcuts of the datasets are as defined in the text. The pie charts “fraction of data kept” represent the fraction of statistical power remaining in the path. It is computed as the fraction of the variance of H0 for the given result (in this way multiple datasets with the same constraining power in H0 will be assigned equal percentages). We show the percentages relative to the baseline result (V00).
Current usage metrics show cumulative count of Article Views (full-text article views including HTML views, PDF and ePub downloads, according to the available data) and Abstracts Views on Vision4Press platform.
Data correspond to usage on the plateform after 2015. The current usage metrics is available 48-96 hours after online publication and is updated daily on week days.
Initial download of the metrics may take a while.