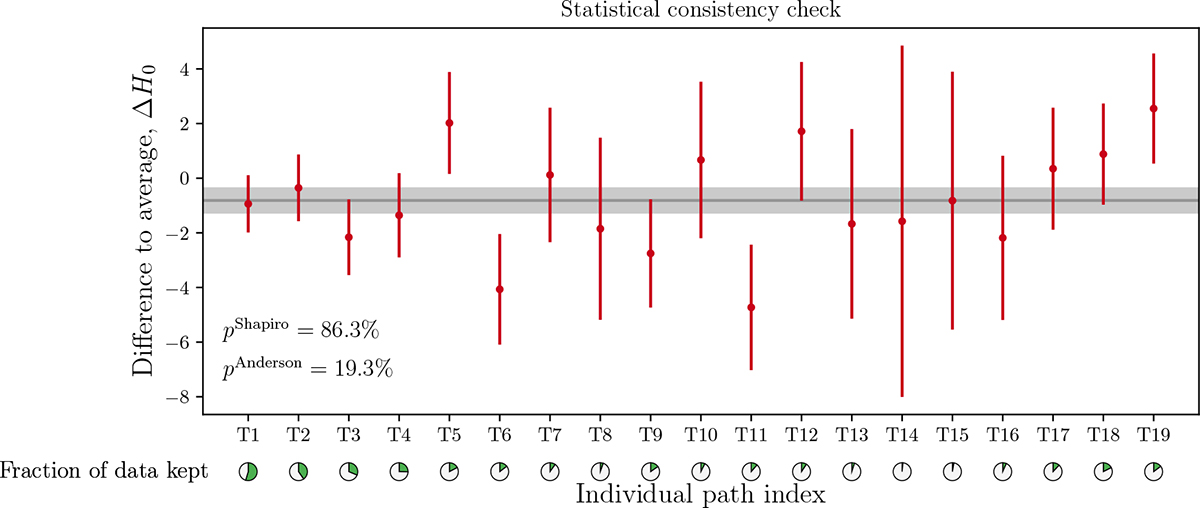
Fig. 13.
Download original image
Statistical consistency of various individual paths through the network. These estimates represent a set of paths that are highly correlated, and they often only take a tiny part of the network into account. They are used for a statistical consistency check and should not be interpreted as valid variants in the sense of Sect. 2.4.2. We also show the simple weighted mean of these paths in gray purely for visual purposes, reminding that due to their correlations (and selection effects) it need not necessarily agree with the baseline result. For details on the pie charts, see Fig. 12.
Current usage metrics show cumulative count of Article Views (full-text article views including HTML views, PDF and ePub downloads, according to the available data) and Abstracts Views on Vision4Press platform.
Data correspond to usage on the plateform after 2015. The current usage metrics is available 48-96 hours after online publication and is updated daily on week days.
Initial download of the metrics may take a while.