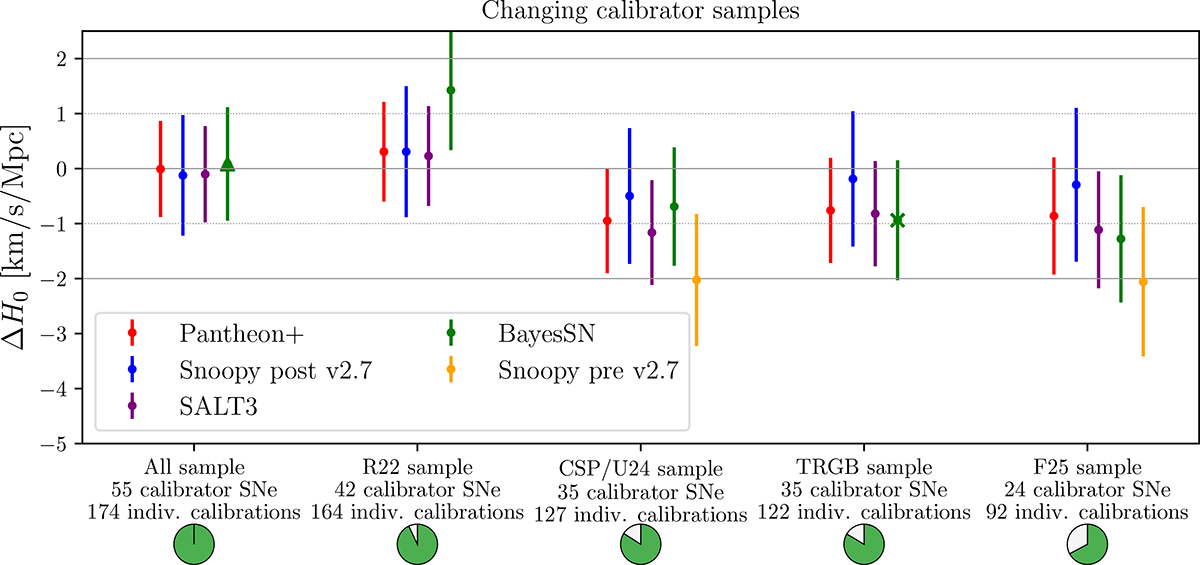
Fig. C.1.
Download original image
Comparison of the impact of supernova type Ia calibrator samples (sets of hosts) on the Hubble constant inference H0, each one relative to the baseline result, for the various light curve fitting codes. The triangle shows a case where for the bayesSN fitter only 52 out of the 55 hosts was calibrated due to several missing supernovae in the fit, and the cross one where only 32 out of 35 hosts were calibrated. (For details on the pie charts, see Fig. 13.) In this case we take 100% of the pies to be the case involving all supernovae data instead of the baseline.
Current usage metrics show cumulative count of Article Views (full-text article views including HTML views, PDF and ePub downloads, according to the available data) and Abstracts Views on Vision4Press platform.
Data correspond to usage on the plateform after 2015. The current usage metrics is available 48-96 hours after online publication and is updated daily on week days.
Initial download of the metrics may take a while.