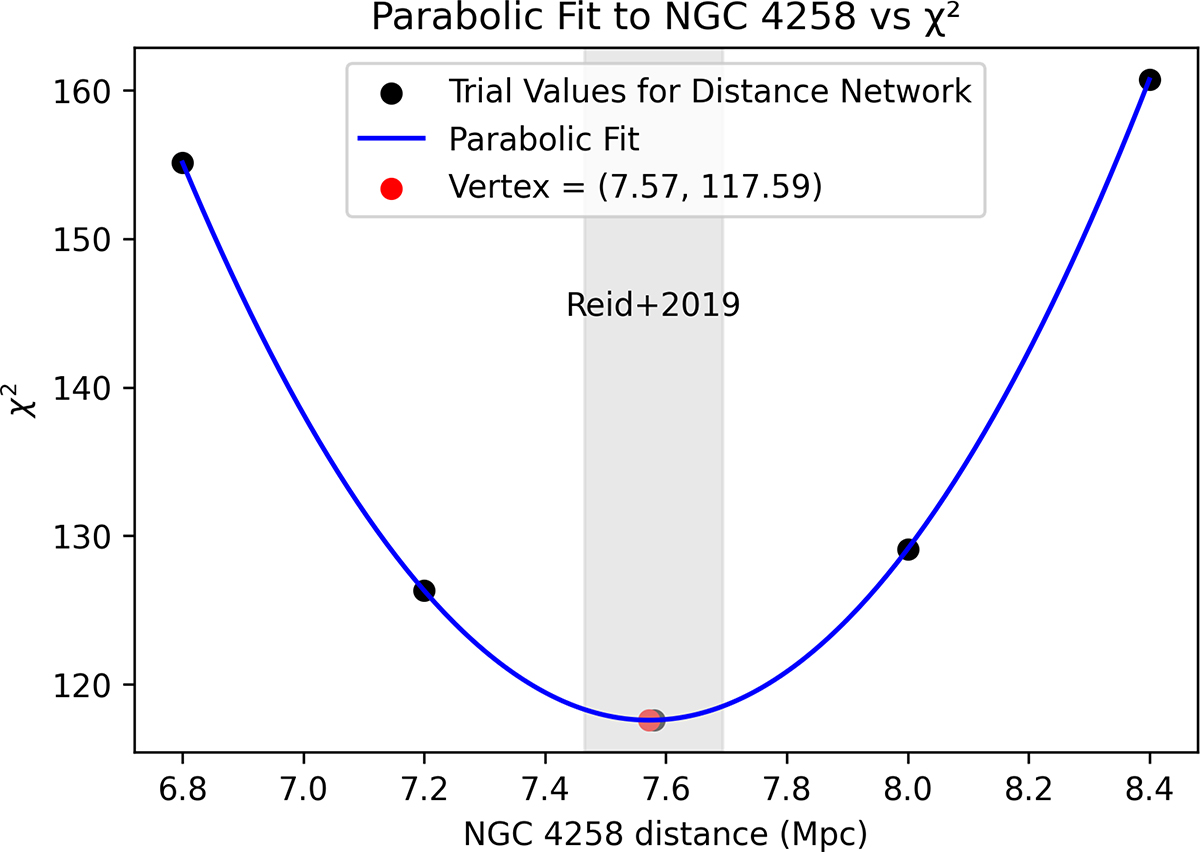
Fig. D.1.
Download original image
Trial values for the distance to NGC 4258 and associated χ2 values. Besides the Reid et al. (2019) measure at D = 7.58 ± 0.11 Mpc (shown as gray band) we also tried increasing or decreasing the distance by ±5% and 10% (black crosses). The result its a large internal inconsistency in the distance network (due to other geometric anchors) that is highly significant. (See also Table D.1 for impact to H0). The global minimum (vertex) is marked by a red cross.
Current usage metrics show cumulative count of Article Views (full-text article views including HTML views, PDF and ePub downloads, according to the available data) and Abstracts Views on Vision4Press platform.
Data correspond to usage on the plateform after 2015. The current usage metrics is available 48-96 hours after online publication and is updated daily on week days.
Initial download of the metrics may take a while.