Fig. 5.
Download original image
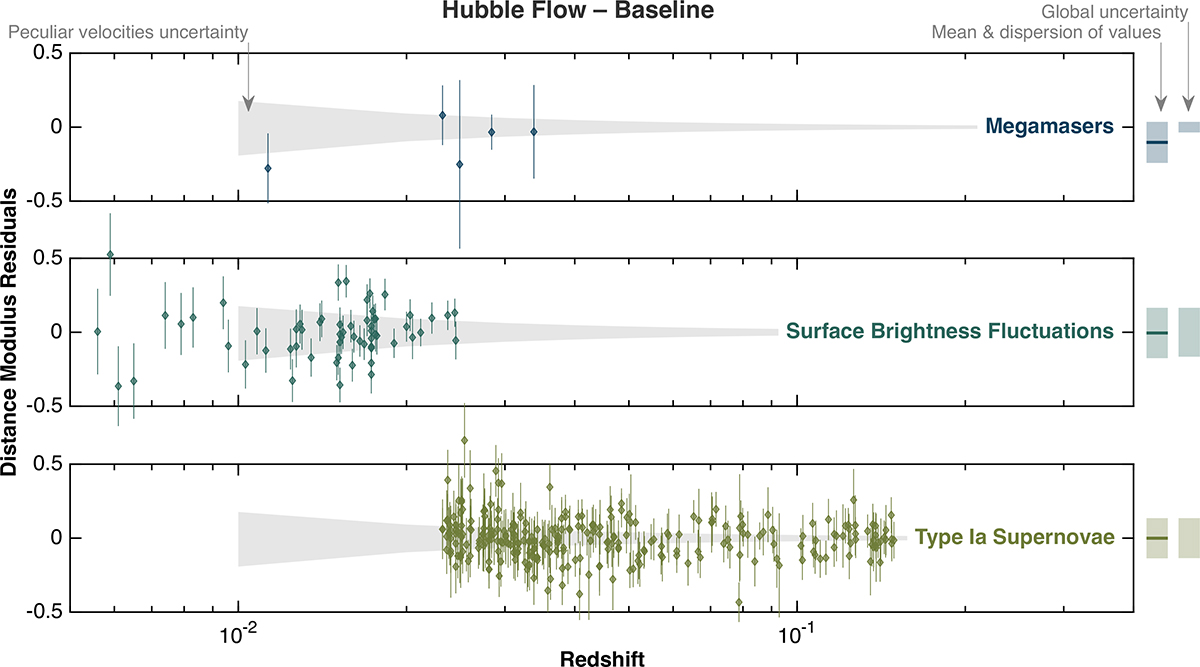
Residuals in distance modulus as a function of redshift for objects in the Hubble flow in the Baseline solution. Error bars reflect the individual source scatter, without the common calibration uncertainty. The shaded region in each plot indicates the effect of a velocity uncertainty of 250 km s−1. The bars at the right show the mean and dispersion for each group of sources and the calibration uncertainty, which is a common error mode for all points in each panel.
Current usage metrics show cumulative count of Article Views (full-text article views including HTML views, PDF and ePub downloads, according to the available data) and Abstracts Views on Vision4Press platform.
Data correspond to usage on the plateform after 2015. The current usage metrics is available 48-96 hours after online publication and is updated daily on week days.
Initial download of the metrics may take a while.