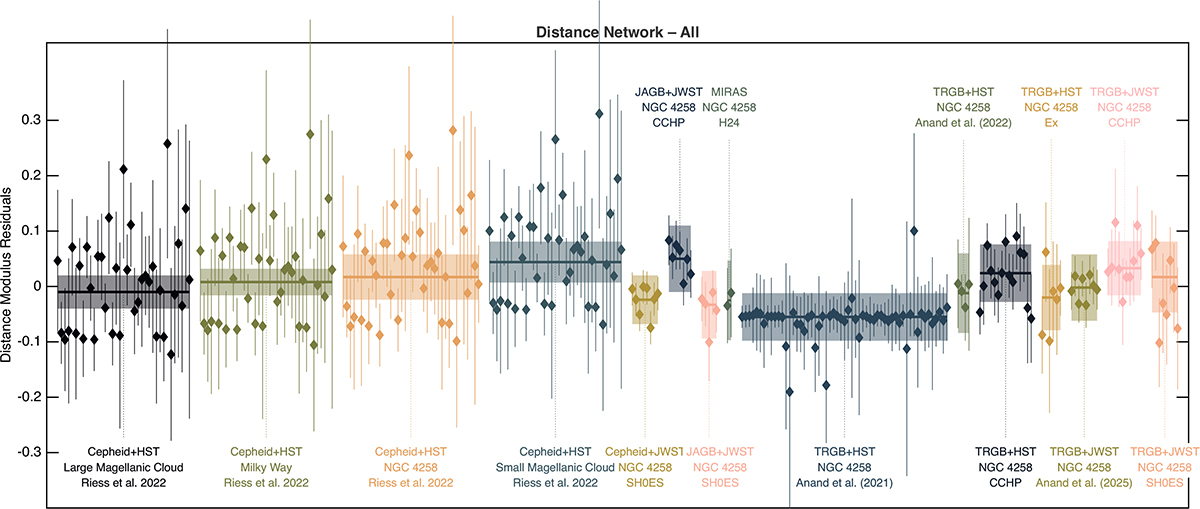
Fig. 9.
Download original image
Residuals for host and calibrator distances for the “everything” solution. The groupings, also distinguished by color, correspond to calibrators measured by the same authors with a common method and anchor. The error bars reflect the individual calibrator errors. The shaded areas for each group indicate the combined uncertainty in the anchor distance and its reference value, which are in common for all calibrators in the same grouping.
Current usage metrics show cumulative count of Article Views (full-text article views including HTML views, PDF and ePub downloads, according to the available data) and Abstracts Views on Vision4Press platform.
Data correspond to usage on the plateform after 2015. The current usage metrics is available 48-96 hours after online publication and is updated daily on week days.
Initial download of the metrics may take a while.