Fig. 2.
Download original image
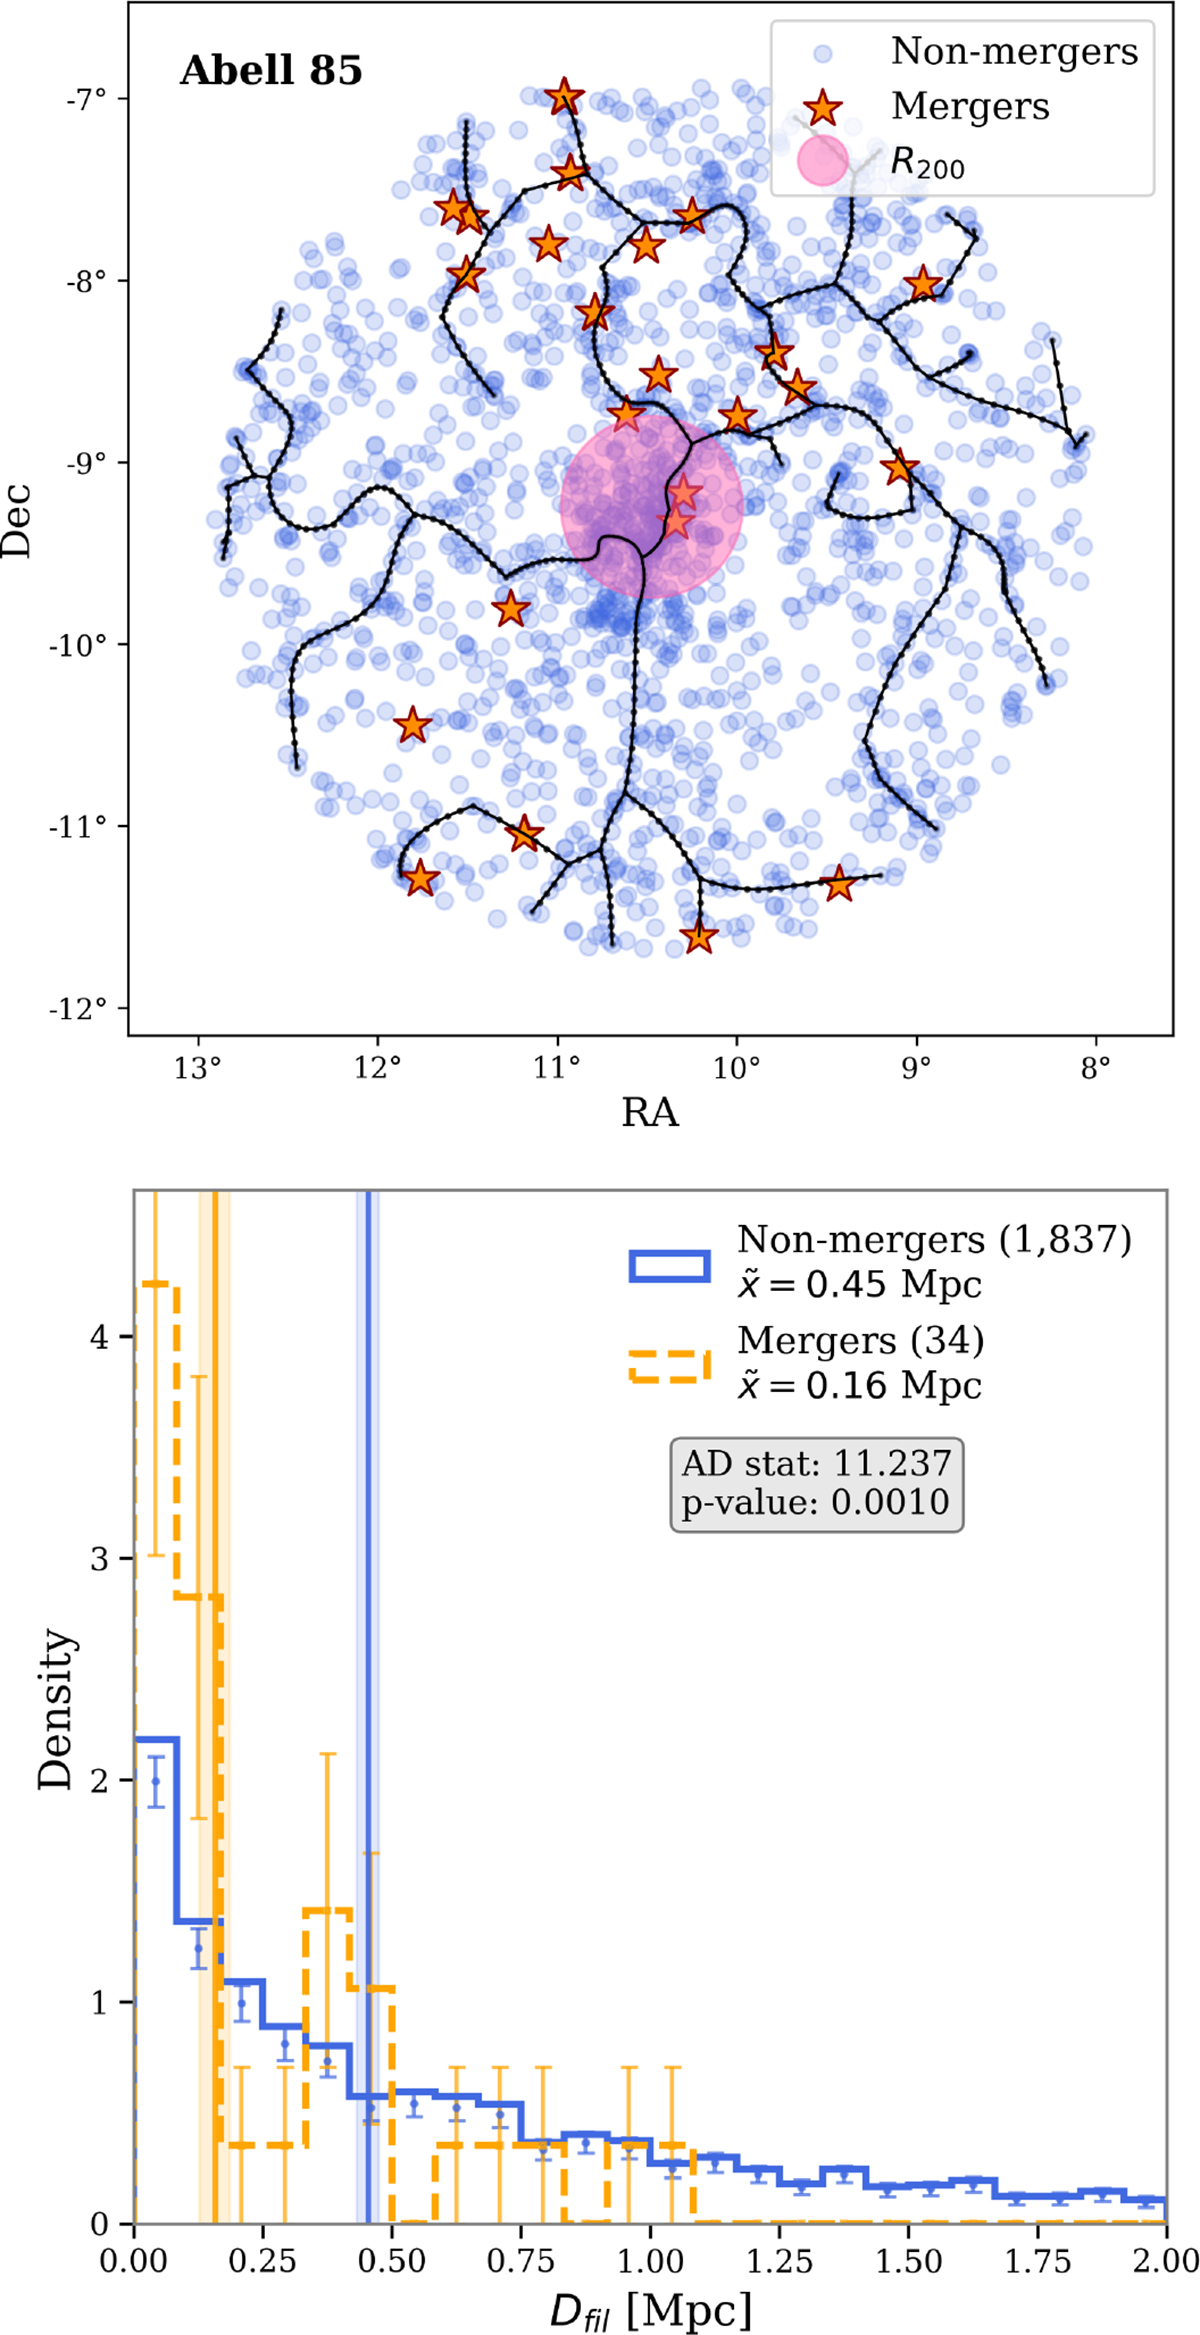
Distribution of galaxy mergers in the example cluster Abell 85. Top: Spatial distribution of galaxies in the cluster out to 5 R200 showing merging galaxies (orange stars) and non-merging galaxies (blue dots) relative to intracluster filaments (black lines). The pink circle denotes the R200 radius for reference. Bottom: Normalised distribution of Dfil, comparing merging galaxies (orange) with the non-merging galaxy population (blue) at r < 5 × R200. Symbols are as in Fig. 1. In this cluster mergers are significantly closer to filaments by a factor of 2.6, compared with non-merging galaxies.
Current usage metrics show cumulative count of Article Views (full-text article views including HTML views, PDF and ePub downloads, according to the available data) and Abstracts Views on Vision4Press platform.
Data correspond to usage on the plateform after 2015. The current usage metrics is available 48-96 hours after online publication and is updated daily on week days.
Initial download of the metrics may take a while.