| Issue |
A&A
Volume 708, April 2026
|
|
|---|---|---|
| Article Number | L5 | |
| Number of page(s) | 10 | |
| Section | Letters to the Editor | |
| DOI | https://doi.org/10.1051/0004-6361/202558037 | |
| Published online | 31 March 2026 | |
Letter to the Editor
Caught in the web: Galaxy mergers along cosmic filaments
1
Universidad de Concepción, Víctor Lamas 1290, Barrio Universitario, Concepción, Chile
2
Departamento de Física, Universidad Técnica Federico Santa María, Avenida España 1680, Valparaíso, Chile
3
Millennium Nucleus for Galaxies (MINGAL), Valparaíso, Chile
4
Instituto de Física, Pontificia Universidad Católica de Valparaíso, Casilla 4059, Valparaíso, Chile
5
Departamento de Astronomía, Universidad de La Serena, Avda. Raúl Bitrán 1305, La Serena, Chile
6
Instituto de Astronomía y Ciencias Planetarias (INCT), Universidad de Atacama, Copayapu 485, Copiapó, Chile
7
Departamento de Física Teórica y del Cosmos, Edificio Mecenas, Campus Fuentenueva, Universidad de Granada, E-18071, Granada, Spain
8
Instituto Universitario Carlos I de Física Teórica y Computacional, Universidad de Granada, 18071, Granada, Spain
9
Instituto de Física y Astronomía, Universidad de Valparaíso, Avda. Gran Bretaña 1111, Valparaíso, Chile
10
Centre of Excellence for Data Science, Artificial Intelligence & Modelling, The University of Hull, Cottingham Road, Kingston-Upon-Hull, HU6 7RX, UK
11
Centro Brasileiro de Pesquisas Físicas, Rua Dr. Xavier Sigaud 150, Rio de Janeiro, RJ, Brazil
12
Institute of Astronomy, University of Cambridge, Madingley Road, Cambridge, CB3 0HA, United Kingdom
13
Department of Physics, University of Helsinki, Gustaf Hällströmin katu 2, 00560, Helsinki, Finland
14
School of Physics & Astronomy, University of Nottingham, Nottingham, NG7 2RD, UK
15
INAF–Osservatorio Astronomico di Capodimonte, Salita Moiariello 16, I-80134, Napoli, Italy
16
Departamento de Astronomia, Instituto de Astronomia, Geofísica e Ciências Atmosféricas, Universidade de São Paulo, São Paulo, Brazil
17
Institute of Astrophysics, Facultad de Ciencias Exactas, Universidad Andrés Bello, Sede Concepción, Talcahuano, Chile
18
Escola Politécnica, Universidade de São Paulo, Av. Prof. Luciano Gualberto, Travessa do Politécnico 380, São Paulo, Brazil
19
Max-Planck-Institut für Extraterrestrische Physik (MPE), Gießenbachstraße 1, D-85748, Garching bei München, Germany
★ Corresponding author: This email address is being protected from spambots. You need JavaScript enabled to view it.
Received:
9
November
2025
Accepted:
4
March
2026
Abstract
Context. Galaxy clusters grow through the accretion of galaxies from groups, filaments, and other clusters. During this process, galaxies may undergo pre-processing in lower density environments, where galaxy–galaxy mergers and other interactions can significantly alter their properties prior to cluster infall.
Aims. We investigate the role of galaxy mergers in the pre-processing of galaxies prior to cluster infall by studying the spatial distribution of galaxy mergers across the cosmic web.
Methods. We used a sample of 43 922 galaxies being targeted by the 4MOST CHANCES survey in and around 33 low-redshift clusters (z < 0.07). Using Zoobot, a deep-learning framework trained on Galaxy Zoo data, we identified 698 galaxy mergers. We measured their distances to cosmic web filaments and compared those results to those of non-merging galaxies.
Results. We find that galaxy mergers are significantly closer to filaments than the non-merging galaxy population, with this trend being strongest beyond the cluster virial radius. This suggests that filaments provide conditions conducive to mergers, possibly moderating relative velocities and enhancing gas availability.
Conclusions. Our findings support a scenario in which filaments play a key role in transforming (pre-processing) galaxies by promoting mergers before entering the cluster cores where star formation is quenched.
Key words: galaxies: clusters: general / galaxies: evolution / galaxies: interactions / large-scale structure of Universe
© The Authors 2026
 Open Access article, published by EDP Sciences, under the terms of the Creative Commons Attribution License (https://creativecommons.org/licenses/by/4.0), which permits unrestricted use, distribution, and reproduction in any medium, provided the original work is properly cited.
This article is published in open access under the Subscribe to Open model. This email address is being protected from spambots. You need JavaScript enabled to view it. to support open access publication.
1. Introduction
Understanding galaxy evolution requires considering both intrinsic properties and the environment in which galaxies reside. In the current cosmological framework, based on the hierarchical structure formation paradigm, cosmic structures grow via the gravitational merging of smaller units over time. This process builds up the large-scale structure (LSS) of the Universe: from galaxies to groups and, ultimately, massive galaxy clusters interconnected by filaments and separated by voids (White & Rees 1978; Press & Schechter 1974). Observations provide compelling evidence for hierarchical growth, where galaxies are accreted along filaments into larger systems (Zwicky 1933; Eke et al. 1996).
A wide array of physical mechanisms influence galaxy properties throughout this hierarchical growth. These include internal processes, such as star formation and active galactic nucleus feedback, as well as environmental effects such as gas stripping via ram-pressure from the intracluster medium, tidal interactions, and galaxy-galaxy mergers (Boselli & Gavazzi 2006; Alonso et al. 2007; Darg et al. 2010; Weigel et al. 2018; Ellison et al. 2019). Each of these effects can significantly alter a galaxy’s morphology, star formation activity, and gas content, contributing to the broad diversity observed throughout the galaxy population today. Mergers can alter the kinematics of galaxies (including spin orientation), reshape galactic disks, trigger intense starburst events, and feed central supermassive black holes, potentially igniting active galactic nucleus activity (Toomre & Toomre 1972; Barnes & Hernquist 1992; Hopkins et al. 2006; Cox et al. 2006; Welker et al. 2014; Barsanti et al. 2025).
These environmental mechanisms are expected to act in different locations of the cosmic web. In dense cluster cores for instance, galaxies experience significant gas removal through ram-pressure stripping (Jaffé et al. 2015; Cortese et al. 2021). However, a substantial fraction of galaxies enter clusters already quenched, suggesting that they undergo ‘pre-processing’ in lower-density environments prior to cluster infall (Fujita 2004; Haines et al. 2015; Lopes et al. 2024).
In intermediate-density environments (e.g. galaxy groups or the outskirts of clusters), mechanisms such as galaxy-galaxy mergers are expected to be more effective, as the lower relative velocities facilitate gravitational binding (Boselli & Gavazzi 2006). Recent observational results using deep learning classifications (Omori et al. 2023) show that merger incidence increases in lower-density environments on scales of 0.5 − 0.8 h−1 Mpc, compared to dense environments. This is supported by simulations, which indicate that galaxy mergers preferentially occur in environments with lower relative velocities, such as intermediate-mass haloes, rather than in massive cluster cores (Jian et al. 2012).
Despite this framework, observational studies of mergers at filament–cluster interfaces remain limited, and the specific role of mergers in the pre-processing of galaxies along filaments has not yet been explored in a systematic way. In this work, we explore the role of galaxy mergers in the pre-processing of galaxies falling into clusters. As the main channel of galaxy accretion into clusters is through large-scale filaments (Cautun et al. 2014), we focus our analysis on the distribution of galaxy mergers relative to filaments feeding clusters. Specifically, we investigate whether galaxy mergers tend to occur along filamentary structures and how this tendency varies with distance from the cluster centre. Throughout this Letter, R200 refers to the radius within which the mean density is 200 times the critical density at the cluster redshift. We adopted a Planck 2020 cosmology with H0 = 67.4 km s−1 Mpc−1 and Ωm = 0.315.
2. Dataset
2.1. Cluster and galaxy sample
This Letter focuses on galaxies in clusters at z < 0.07 from the Low-z sub-survey of the 4-metre Multi-Object Spectroscopic Telescope (4MOST) CHileAN Cluster galaxy Evolution Survey (CHANCES; Haines et al. 2023; Sifón et al. 2025). This survey is tailored to study galaxy pre-processing and will obtain ∼500 000 spectra of galaxies within and around more than 100 clusters out to 5 × R200 at 0 < z < 0.45 with the 4MOST instrument on the 4 m VISTA telescope (de Jong et al. 2019), down to low stellar masses (mr < 20.4 mag).
2.2. Large-scale environment of galaxies
To characterise the galaxy environment, we focussed on galaxies out to 5 × R200 from the cluster centre, selected using photometric redshifts from the Dark Energy Spectroscopic Instrument (DESI) Legacy Surveys Data Release 10 (LS–DR10; Zhou et al. 2021), following the CHANCES target selection strategy, which selects cluster galaxies in redshift slices centred on each cluster redshift (see Méndez-Hernández et al. 2026, for details). For the environmental characterisation, we limited the sample to galaxies brighter than mr = 18.5 mag1, where the completeness and purity in the selection of cluster members is high (∼80%) thanks to the reduced photometric redshift uncertainty (⟨σz⟩≃0.145 for LS–DR10, and ⟨σz⟩≃0.044 for our improved LS–DR10–CBPF estimates; see Méndez-Hernández et al. 2026). Using this magnitude range, Baier-Soto et al. (2025) has already shown that filaments can be adequately identified with photometric members.
In our study, the filament identification process was carried out in 2D using the Discrete Persistence Structures Extractor (DisPerSE2; Sousbie 2011), which is widely used for detecting cosmic web components in observations (Bonjean et al. 2020) and simulations (Galárraga-Espinosa et al. 2020; Kuchner et al. 2020; Kraljic et al. 2020; Malavasi et al. 2022). We applied boundary conditions for smooth Delaunay tessellation, with a persistence threshold at 3σ and smoothness level of 20, following Baier-Soto et al. (2025). Galaxy–filament distances (Dfil) were computed via the point-line method (see Appendix A) along with the projected distance to the cluster centre (rcl).
2.3. Galaxy morphology
To obtain morphological information for the photometric members, we cross-matched the CHANCES catalogue of target galaxies with catalogues containing data from Galaxy Zoo DESI (GZDESI; Walmsley et al. 2023b), which provides automated morphology measurements based on deep images from the DESI Legacy Imaging Surveys DR8 (DESI-LS-DR8; Dey et al. 2019). The GZDESI morphologies were derived using Zoobot (Walmsley et al. 2023a), a deep learning model trained to replicate the consensus of the Galaxy Zoo volunteer classifications. For each galaxy, Zoobot predicts vote fractions: the expected proportion of human classifiers who would select a given morphological label (e.g. ‘smooth’ or ‘featured’).
While not all galaxies in the CHANCES Low-z survey had a match in the morphological catalogues of GZDESI (since CHANCES is based on DESI LS-DR10, rather than DR8 used for GZDESI), 43 922 galaxy matches were found spread across 33 different clusters (noting that 8 clusters are not fully covered by GZDESI; see the blue points in Fig. D.1). This sample of galaxies represents the general galaxy population, which includes both merging and non-merging galaxies.
To identify galaxies undergoing mergers using the GZDESI classifications, we considered the vote fractions predicted by Zoobot in the following categories: merger (M-M), major disturbance (M-D), minor disturbance, and none. We visually inspected galaxies with different vote fractions for a random sub-sample of 2000 galaxies to define a threshold that allowed us to build a reliable galaxy-galaxy merger sample. We adopted the following thresholds: FMM ≥ 0.5 or FMD ≥ 0.5, where FMM and FMD correspond to the predicted vote fractions for the M-M and M-D cases, respectively3. These thresholds yield a high purity (78%) at the expense of completeness (45%), which translates to a selection of evident cases of major mergers or disturbances. To ensure this level of purity, we excluded galaxies with minor disturbances or no signs of interaction, which would dilute the sample.
A total of 698 galaxy mergers were identified, corresponding to ∼2% of the sample, implying that the remaining 43 224 galaxies are classified as non-mergers. This merger fraction is low, but expected in the context of cluster environments (see e.g. Kim et al. 2024), especially given our conservative criteria for selecting mergers. Fig. B.1 shows a few randomly selected example galaxies classified as mergers.
3. Results: Distribution of mergers across the cosmic web
To determine whether galaxy mergers contribute to the pre-processing of galaxies in filaments before they enter clusters, we compared their spatial distribution in the cosmic web to that of the general galaxy population (43 922 galaxies). This reference sample includes mergers, allowing us to test whether they exhibit distinct environmental preferences using the Anderson-Darling k-sample (AD) test.
Fig. 1 shows the distribution of Dfil for all merging galaxies compared to the general galaxy population, across different regions: the entire region analyzed (r < 5 × R200), in the cluster region (r < R200), and in the cluster outskirts (R200 < r < 5 × R200). In two cases, galaxy mergers are preferentially located closer to the filaments than the general galaxy population, with the difference being more pronounced outside the virialised region of the cluster, where merging galaxies have a median filament distance of  Mpc, compared to
  Mpc for the non-merging galaxies, as shown in the right panel of Fig. 1. The quoted uncertainties correspond to the 16th–84th percentiles derived from 1000 bootstrap re-samplings (1σ confidence intervals).
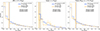 |
Fig. 1. Normalised distribution of Dfil for all merging galaxies (dashed orange line) compared to the non-merging galaxy population (dotted blue line). Left: Distribution for galaxies across the entire cluster region (r < 5 × R200). Middle: Galaxies in the inner cluster region (r < R200). Right: Galaxies in the cluster outskirts (R200 < r < 5 × R200). For visualisation purposes, the distances to filaments have been truncated at 2 Mpc, beyond which the galaxy density drops consistently below ∼0.2. Error bars correspond to Poisson uncertainties in each bin, while vertical lines mark the median of each distribution. Shaded regions indicate the 68% bootstrap confidence intervals (percentiles 16–84) around the median. The AD statistics and p-values comparing both distributions are shown in the legend. The AD statistics show that galaxy mergers are preferentially located closer to filaments than non-merging galaxies, both at all radii and specifically outside the virial region. Distances to filaments are truncated at 2 Mpc in the plots for visibility, although the full distributions extend up to ∼4 Mpc. |
While the difference in the medians is small, the difference in the shape of the distributions has statistical significance according to the AD test, which yields p-values well below 0.074 outside the virial region. Considering that the typical filament thickness is ∼0.7 − 1 Mpc (e.g. Tempel et al. 2014; Kuchner et al. 2020), this result suggests that mergers are more likely to occur within the filamentary structures themselves. The fact that the trend is more pronounced in the cluster outskirts is not surprising, as the relative velocities between galaxies there are low enough to allow mergers. Hence, in the rest of the analysis, we considered only the outer regions of clusters. However, we assessed possible edge effects on the filament detections by re-doing the analysis, using an area limited to r < 4.8 × R200, and we obtained the same results and significance.
We also note that the mass distributions of the merger and non-merger samples are very similar but not statistically identical. Nonetheless, we checked that our results do not change when matching the stellar mass distributions (see Appendix C).
When examining the distribution of mergers cluster-by-cluster (shown in Fig. D.2), we found statistically suggestive evidence (p < 0.07) that mergers preferentially occur near filaments in ∼39% of our sample in the outer regions. For the remaining clusters, although a visual inspection suggests similar distribution patterns to those with statistically significant results, the limited number of identified mergers prevents these trends from reaching statistical significance.
Abell 85, a massive relaxed cluster in our sample, provides the strongest example of merger-filament connection, as shown in Fig. 2. In this cluster, mergers clearly trace the filamentary structure, supported by statistical indicators, including a p-value of 0.001 and a median distance difference of 0.29 Mpc between merging galaxies and the general population.
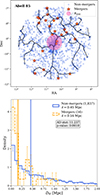 |
Fig. 2. Distribution of galaxy mergers in the example cluster Abell 85. Top: Spatial distribution of galaxies in the cluster out to 5 R200 showing merging galaxies (orange stars) and non-merging galaxies (blue dots) relative to intracluster filaments (black lines). The pink circle denotes the R200 radius for reference. Bottom: Normalised distribution of Dfil, comparing merging galaxies (orange) with the non-merging galaxy population (blue) at r < 5 × R200. Symbols are as in Fig. 1. In this cluster mergers are significantly closer to filaments by a factor of 2.6, compared with non-merging galaxies. |
Our results suggest that filamentary structures play an important role in galaxy evolution by facilitating merger events that may contribute to the pre-processing of galaxies before they fully enter the cluster environment.
4. Discussion
We find a clear spatial association between galaxy mergers and the filamentary structure of the cosmic web, comprising the first direct observational evidence of enhanced merger activity along cluster-feeding filaments. This connection is strongest beyond the virial radius, where lower relative velocities and the filamentary geometry likely promote gravitational interactions. Thus, filaments do not only channel galaxies into clusters, but they also serve as active sites of pre-processing through mergers.
Our findings agree with simulations predicting enhanced merger activity, morphological transformation, and spin reorientation within filaments (Welker et al. 2014; Dubois et al. 2014; Kuutma et al. 2017; Singh et al. 2020). Finally, they confirm previous indirect observational hints towards such a scenario (Malavasi et al. 2016; Mesa et al. 2018; Omori et al. 2023; Rong et al. 2024). Our analysis is nevertheless subject to several limitations. In particular, filament reconstruction relies on projected galaxy distributions and photometric redshifts, so line-of-sight uncertainties and shot noise can blur filament positions and dilute the signal. Moreover, our conservative merger selection prioritises purity over completeness, likely underestimating the true merger incidence. Future studies using spectroscopy and more detailed merger identification will help confirm our results.
5. Conclusions
We investigated the role of cosmic filaments in promoting galaxy mergers as part of the pre-processing of galaxies prior to their infall into clusters. Using a sample of ∼40 000 galaxies in and around 33 low-redshift (z < 0.07) clusters from the CHANCES survey, we studied the spatial distribution of mergers across the cosmic web. Our main finding is that galaxy mergers are preferentially located near filaments outside the virial region of clusters.
These results provide evidence that cosmic filaments are not merely passive conduits of galaxy infall, but active sites of transformation, where mergers contribute to the pre-processing of galaxies prior to cluster infall. In future works, we aim to expand this analysis using the full CHANCES sample through a dedicated citizen science project that incorporates additional physical mechanisms at play. We will also enrich the analysis with 4MOST spectroscopy, more complex local and global environmental metrics, and comparisons with cosmological hydrodynamical simulations, which can help constrain the underlying physical drivers of filament-driven evolution. Moreover, we will explore whether mergers preferentially occur within galaxy groups and sub-structures embedded in filaments by comparing the impact of local and LSS environments, once we have access to robust group and sub-structure catalogues and central and satellite classifications published by CHANCES.
Acknowledgments
YLJ and RS acknowledge support from Agencia Nacional de Investigación y Desarrollo (ANID) through FONDECYT Regular projects 1241426 and 1230441. YLJ, CD, HMH, CPH, RBS, FPC, EI, VMS, RS and DP gratefully acknowledge financial support from the Millennium Science Initiative Program NCN2024_112. YLJ, RBS, HMH, AM, RD gratefully acknowledge support from the ANID BASAL project FB210003. RBS acknowledges support from ANID/Subdirección de Capital Humano/Doctorado Nacional/2023-21231017. PVB and MAF acknowledge support from the research project PID2023-150178NB-I00 and PID2023-149578NB-I00, financed by MCIN/AEI/10.13039/501100011033, the project A-FQM-510-UGR20 financed from FEDER/Junta de Andalucía-Consejería de Transformación Económica, Industria, Conocimiento y Universidades/Proyecto, by the grants P20_00334 and FQM108, financed by the Junta de Andalucía (Spain), the Emergia program (EMERGIA20_38888) from Junta de Andalucía, and the Grant AST22-4.4, funded by Consejería de Universidad, Investigación e Innovación and Gobierno de España and Unión Europea – NextGenerationEU. CPH acknowledges support from ANID through Fondecyt Regular project number 1252233. HMH acknowledges support from ANID through Fondecyt project 3230176. AM acknowledges support from the ANID FONDECYT Regular grant 1251882, and funding from the HORIZON-MSCA-2021-SE-01 Research and Innovation Programme under the Marie Sklodowska-Curie grant agreement number 101086388. MSC acknowledges support from São Paulo Research Foundation (FAPESP) grant 2023/10774-5 and funding to the S-PLUS project through the process 2019/26492-3. EI gratefully acknowledges financial support from ANID FONDECYT Regular 1221846. CLD acknowledges support from the ANID through Fondecyt project 3250511. GD acknowledges support by UKRI-STFC grants: ST/T003081/1 and ST/X001857/1. We thank A. J. Koch-Hansen, S. Barsanti and A. Fritz for useful comments.
References
- Alonso, M. S., Lambas, D. G., Tissera, P., & Coldwell, G. 2007, MNRAS, 375, 1017 [NASA ADS] [CrossRef] [Google Scholar]
- Baier-Soto, R., Jaffé, Y., Finoguenov, A., et al. 2025, A&A, 704, A228 [NASA ADS] [CrossRef] [EDP Sciences] [Google Scholar]
- Barnes, J. E., & Hernquist, L. 1992, ARA&A, 30, 705 [Google Scholar]
- Barsanti, S., Croom, S. M., Colless, M., et al. 2025, MNRAS, 538, 2660 [Google Scholar]
- Bonjean, V., Aghanim, N., Douspis, M., Malavasi, N., & Tanimura, H. 2020, A&A, 638, A75 [NASA ADS] [CrossRef] [EDP Sciences] [Google Scholar]
- Boselli, A., & Gavazzi, G. 2006, PASP, 118, 517 [Google Scholar]
- Cautun, M., van de Weygaert, R., Jones, B. J. T., & Frenk, C. S. 2014, MNRAS, 441, 2923 [Google Scholar]
- Cortese, L., Catinella, B., & Smith, R. 2021, PASA, 38, e035 [NASA ADS] [CrossRef] [Google Scholar]
- Cox, T. J., Dutta, S. N., Di Matteo, T., et al. 2006, ApJ, 650, 791 [Google Scholar]
- Darg, D. W., Kaviraj, S., Lintott, C. J., et al. 2010, MNRAS, 401, 1552 [NASA ADS] [CrossRef] [Google Scholar]
- de Jong, R. S., Agertz, O., Berbel, A. A., et al. 2019, The Messenger, 175, 3 [NASA ADS] [Google Scholar]
- Dey, A., Schlegel, D. J., Lang, D., et al. 2019, AJ, 157, 168 [Google Scholar]
- Dubois, Y., Pichon, C., Welker, C., et al. 2014, MNRAS, 444, 1453 [Google Scholar]
- Eke, V. R., Cole, S., & Frenk, C. S. 1996, MNRAS, 282, 263 [CrossRef] [Google Scholar]
- Ellison, S. L., Viswanathan, A., Patton, D. R., et al. 2019, MNRAS, 487, 2491 [NASA ADS] [CrossRef] [Google Scholar]
- Fujita, Y. 2004, PASJ, 56, 29 [NASA ADS] [Google Scholar]
- Galárraga-Espinosa, D., Aghanim, N., Langer, M., et al. 2020, A&A, 641, A173 [NASA ADS] [CrossRef] [EDP Sciences] [Google Scholar]
- Haines, C. P., Pereira, M. J., Smith, G. P., et al. 2015, ApJ, 806, 101 [NASA ADS] [CrossRef] [Google Scholar]
- Haines, C., Jaffé, Y., Tejos, N., et al. 2023, The Messenger, 190, 31 [NASA ADS] [Google Scholar]
- Hopkins, P. F., Hernquist, L., Cox, T. J., et al. 2006, ApJS, 163, 1 [Google Scholar]
- Jaffé, Y. L., Smith, R., Candlish, G. N., et al. 2015, MNRAS, 448, 1715 [Google Scholar]
- Jian, H.-Y., Lin, L., & Chiueh, T. 2012, ApJ, 754, 26 [NASA ADS] [CrossRef] [Google Scholar]
- Kim, D., Sheen, Y.-K., Jaffé, Y. L., et al. 2024, ApJ, 966, 124 [NASA ADS] [CrossRef] [Google Scholar]
- Kraljic, K., Pichon, C., Codis, S., et al. 2020, MNRAS, 491, 4294 [Google Scholar]
- Kuchner, U., Aragón-Salamanca, A., Pearce, F. R., et al. 2020, MNRAS, 494, 5473 [NASA ADS] [CrossRef] [Google Scholar]
- Kuutma, T., Tamm, A., & Tempel, E. 2017, A&A, 600, L6 [NASA ADS] [CrossRef] [EDP Sciences] [Google Scholar]
- Lopes, P. A. A., Ribeiro, A. L. B., & Brambila, D. 2024, MNRAS, 527, L19 [Google Scholar]
- Malavasi, N., Arnouts, S., Vibert, D., et al. 2016, MNRAS, 465, 3817 [Google Scholar]
- Malavasi, N., Langer, M., Aghanim, N., Galárraga-Espinosa, D., & Gouin, C. 2022, A&A, 658, A113 [NASA ADS] [CrossRef] [EDP Sciences] [Google Scholar]
- Méndez-Hernández, H., Lima-Dias, C., Monachesi, A., et al. 2026, A&A, 706, A34 [NASA ADS] [CrossRef] [EDP Sciences] [Google Scholar]
- Mesa, V., Duplancic, F., Alonso, S., et al. 2018, A&A, 619, A24 [NASA ADS] [CrossRef] [EDP Sciences] [Google Scholar]
- Omori, K. C., Bottrell, C., Walmsley, M., et al. 2023, A&A, 679, A142 [NASA ADS] [CrossRef] [EDP Sciences] [Google Scholar]
- Press, W. H., & Schechter, P. 1974, ApJ, 187, 425 [Google Scholar]
- Rong, Y., Shen, J., & Hua, Z. 2024, MNRAS, 531, L9 [Google Scholar]
- Sifón, C., Finoguenov, A., Haines, C. P., et al. 2025, A&A, 697, A92 [NASA ADS] [CrossRef] [EDP Sciences] [Google Scholar]
- Singh, A., Mahajan, S., & Bagla, J. 2020, MNRAS, 497, 2265 [Google Scholar]
- Sousbie, T. 2011, MNRAS, 414, 350 [NASA ADS] [CrossRef] [Google Scholar]
- Taylor, E. N., Hopkins, A. M., Baldry, I. K., et al. 2011, MNRAS, 418, 1587 [Google Scholar]
- Tempel, E., Stoica, R., Martinez, V. J., et al. 2014, MNRAS, 438, 3465 [Google Scholar]
- Toomre, A., & Toomre, J. 1972, ApJ, 178, 623 [Google Scholar]
- Walmsley, M., Allen, C., Aussel, B., et al. 2023a, J. Open Source Softw., 8, 5312 [NASA ADS] [CrossRef] [Google Scholar]
- Walmsley, M., Géron, T., Kruk, S., et al. 2023b, MNRAS, 526, 4768 [Google Scholar]
- Weigel, A. K., Schawinski, K., Treister, E., Trakhtenbrot, B., & Sanders, D. B. 2018, MNRAS, 476, 2308 [NASA ADS] [CrossRef] [Google Scholar]
- Welker, C., Devriendt, J., Dubois, Y., Pichon, C., & Peirani, S. 2014, MNRAS, 445, L46 [NASA ADS] [CrossRef] [Google Scholar]
- White, S. D. M., & Rees, M. J. 1978, MNRAS, 183, 341 [Google Scholar]
- Zhou, R., Newman, J. A., Mao, Y.-Y., et al. 2021, MNRAS, 501, 3309 [NASA ADS] [CrossRef] [Google Scholar]
- Zwicky, F. 1933, Helvetica Phys. Acta, 6, 110 [NASA ADS] [Google Scholar]
This limit corresponds to log10(M*/M⊙)∼9.
Note that our conclusions are insensitive to the exact merger probability threshold, remaining stable for values between F = 0.3 − 0.6. Higher thresholds are primarily limited by small-number statistics.
We employ a significance threshold of α = 0.07 for our AD tests to account for the inherent observational bias toward filamentary environments present in both samples. This threshold enhances our sensitivity to detect merger-specific spatial deviations while maintaining statistical rigor (false-positive rate of 7%).
Appendix A: Schematic view of Dfil
We quantified galaxy proximity to LSS using the projected distance to the cluster centre (rcl) and the shortest perpendicular distance to the nearest filament (Dfil), calculated via the point–line method where filament segments connect adjacent nodes (see Fig. A.1). In Fig. A.1 we illustrate the geometric procedure used to compute the distance Dfil between each galaxy and its nearest filament. The filaments are represented as linear segments connecting adjacent nodes, and the minimum galaxy–filament separation is derived using the point–line method described in Sect. 2.
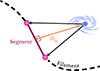 |
Fig. A.1. Schematic representation of the calculation of the minimum distance (Dfil) between a galaxy (blue) and a filament (dashed black curve). The filament is modelled as a set of linear segments (pink line between pink points). The shortest perpendicular distance is computed using the point–line, and is taken as the galaxy–filament distance. |
Appendix B: Examples of merger galaxies
In Fig. B.1 we show examples of merging galaxies identified with ZOOBOT (Walmsley et al. 2023a). Top: Galaxies selected according to the merger fraction (FMM). Bottom: Galaxies selected based on the major disturbed fraction (FMD), according to the criterion described in Sect. 3.
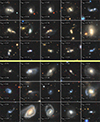 |
Fig. B.1. Examples of randomly selected merging galaxies. Top: Galaxies selected by FMM. Bottom: Galaxies selected by FMD. In both panels, galaxies are arranged from left to right in decreasing order of the corresponding score. |
Appendix C: Controlling for stellar mass
To check that our results are not driven by stellar mass, we have compared the stellar mass distribution of the merger and non-merger galaxy samples. Stellar masses (M★) were computed following the empirical relation between rest-frame (g − i) colour and M★/Li in Taylor et al. (2011) for galaxies with reliable photometric measurements (76% of the sample). The remaining objects lack complete photometric coverage in the required filters and therefore lack a stellar-mass estimate. The top panel of Fig. C.1 shows that, while the 2 distributions look similar, statistically they are likely to be drawn from the same parent distribution. We checked how these differences could affect our results by repeating the analysis using mass-matched samples. To control for stellar mass without significantly reducing the non-merger sample size, we construct a ratio-matched control sample. Specifically, we bin both populations in stellar mass and randomly down-sample the non-merging galaxies within each mass bin according to the relative merger-to-non-merger ratio, so as to reproduce the shape of the merger mass distribution without enforcing equal sample sizes or up-sampling (see the bottom panel of Fig. C.1). This procedure is repeated 1000 times using Monte Carlo. Using this mass-controlled sample, we find that the statistical difference in filament distances between mergers and non-mergers remains unchanged.
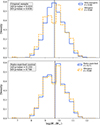 |
Fig. C.1. Stellar mass distributions of merging and non-merging galaxies. Top: Original samples, which are similar in shape but statistically different (AD and KS tests). Bottom: Ratio-matched control sample, where non-mergers are randomly down-sampled in stellar-mass bins to reproduce the merger mass distribution without enforcing equal sample sizes. The result corresponds to one realisation from 1000 Monte Carlo re-samplings. Controlling for stellar mass does not change the conclusions. |
Appendix D: Alignment of mergers with filaments in the entire cluster sample
Figs. D.1 and D.2 present the clusters used in our analysis, ordered by increasing p-value. The first figure shows the spatial distribution of merger candidates along the filaments. The second figure displays the corresponding distributions of distances to the filament for each cluster.
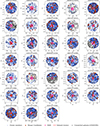 |
Fig. D.1. Distribution of galaxy-galaxy mergers (orange stars) across the 33 clusters in our sample. Black lines represent filaments, the pink circle denotes the virial radius (R200), and blue points correspond to the general cluster galaxy population. For visualisation purposes, grey points represent all unmatched cluster members from the CHANCES catalogue, which were not included in the statistical analysis. |
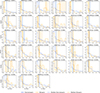 |
Fig. D.2. Normalised distribution of the nearest distances to filaments for galaxy mergers located outside 1 × R200 in the 33 galaxy clusters (dashed orange line), compared to the non-merging cluster galaxy population outside 1 × R200 of each respective cluster (dotted blue line). Error bars correspond to Poisson uncertainties in each bin, while vertical lines mark the median of each distribution. Shaded regions indicate the 68% bootstrap confidence intervals (percentiles 16–84) around the median. Clusters are ordered from lowest to highest p-value, where a lower p-value indicates stronger evidence of a difference between the distributions. Distances to filaments are truncated at 2 Mpc to emphasise the vicinity where most merger candidates are found, although the full distributions extend up to ∼4 Mpc. |
All Figures
|
Fig. 1. Normalised distribution of Dfil for all merging galaxies (dashed orange line) compared to the non-merging galaxy population (dotted blue line). Left: Distribution for galaxies across the entire cluster region (r < 5 × R200). Middle: Galaxies in the inner cluster region (r < R200). Right: Galaxies in the cluster outskirts (R200 < r < 5 × R200). For visualisation purposes, the distances to filaments have been truncated at 2 Mpc, beyond which the galaxy density drops consistently below ∼0.2. Error bars correspond to Poisson uncertainties in each bin, while vertical lines mark the median of each distribution. Shaded regions indicate the 68% bootstrap confidence intervals (percentiles 16–84) around the median. The AD statistics and p-values comparing both distributions are shown in the legend. The AD statistics show that galaxy mergers are preferentially located closer to filaments than non-merging galaxies, both at all radii and specifically outside the virial region. Distances to filaments are truncated at 2 Mpc in the plots for visibility, although the full distributions extend up to ∼4 Mpc. |
| In the text | |
|
Fig. 2. Distribution of galaxy mergers in the example cluster Abell 85. Top: Spatial distribution of galaxies in the cluster out to 5 R200 showing merging galaxies (orange stars) and non-merging galaxies (blue dots) relative to intracluster filaments (black lines). The pink circle denotes the R200 radius for reference. Bottom: Normalised distribution of Dfil, comparing merging galaxies (orange) with the non-merging galaxy population (blue) at r < 5 × R200. Symbols are as in Fig. 1. In this cluster mergers are significantly closer to filaments by a factor of 2.6, compared with non-merging galaxies. |
| In the text | |
|
Fig. A.1. Schematic representation of the calculation of the minimum distance (Dfil) between a galaxy (blue) and a filament (dashed black curve). The filament is modelled as a set of linear segments (pink line between pink points). The shortest perpendicular distance is computed using the point–line, and is taken as the galaxy–filament distance. |
| In the text | |
|
Fig. B.1. Examples of randomly selected merging galaxies. Top: Galaxies selected by FMM. Bottom: Galaxies selected by FMD. In both panels, galaxies are arranged from left to right in decreasing order of the corresponding score. |
| In the text | |
|
Fig. C.1. Stellar mass distributions of merging and non-merging galaxies. Top: Original samples, which are similar in shape but statistically different (AD and KS tests). Bottom: Ratio-matched control sample, where non-mergers are randomly down-sampled in stellar-mass bins to reproduce the merger mass distribution without enforcing equal sample sizes. The result corresponds to one realisation from 1000 Monte Carlo re-samplings. Controlling for stellar mass does not change the conclusions. |
| In the text | |
|
Fig. D.1. Distribution of galaxy-galaxy mergers (orange stars) across the 33 clusters in our sample. Black lines represent filaments, the pink circle denotes the virial radius (R200), and blue points correspond to the general cluster galaxy population. For visualisation purposes, grey points represent all unmatched cluster members from the CHANCES catalogue, which were not included in the statistical analysis. |
| In the text | |
|
Fig. D.2. Normalised distribution of the nearest distances to filaments for galaxy mergers located outside 1 × R200 in the 33 galaxy clusters (dashed orange line), compared to the non-merging cluster galaxy population outside 1 × R200 of each respective cluster (dotted blue line). Error bars correspond to Poisson uncertainties in each bin, while vertical lines mark the median of each distribution. Shaded regions indicate the 68% bootstrap confidence intervals (percentiles 16–84) around the median. Clusters are ordered from lowest to highest p-value, where a lower p-value indicates stronger evidence of a difference between the distributions. Distances to filaments are truncated at 2 Mpc to emphasise the vicinity where most merger candidates are found, although the full distributions extend up to ∼4 Mpc. |
| In the text | |
Current usage metrics show cumulative count of Article Views (full-text article views including HTML views, PDF and ePub downloads, according to the available data) and Abstracts Views on Vision4Press platform.
Data correspond to usage on the plateform after 2015. The current usage metrics is available 48-96 hours after online publication and is updated daily on week days.
Initial download of the metrics may take a while.