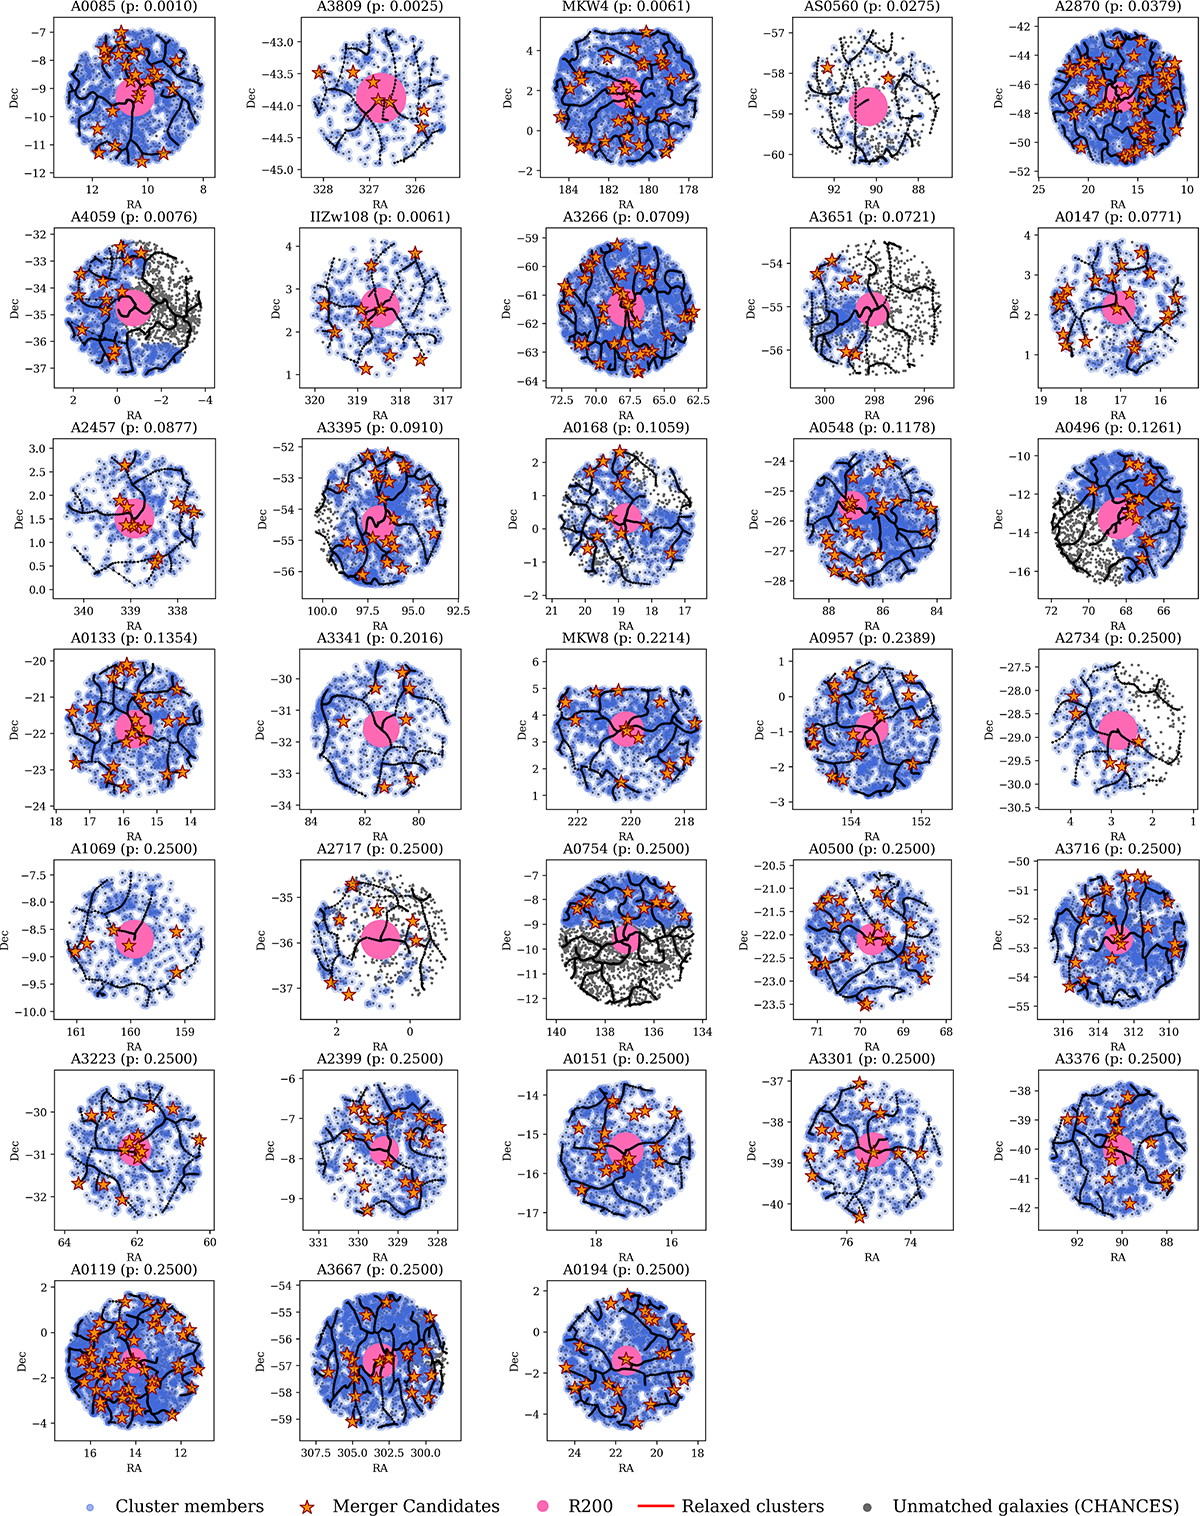
Fig. D.1.
Download original image
Distribution of galaxy-galaxy mergers (orange stars) across the 33 clusters in our sample. Black lines represent filaments, the pink circle denotes the virial radius (R200), and blue points correspond to the general cluster galaxy population. For visualisation purposes, grey points represent all unmatched cluster members from the CHANCES catalogue, which were not included in the statistical analysis.
Current usage metrics show cumulative count of Article Views (full-text article views including HTML views, PDF and ePub downloads, according to the available data) and Abstracts Views on Vision4Press platform.
Data correspond to usage on the plateform after 2015. The current usage metrics is available 48-96 hours after online publication and is updated daily on week days.
Initial download of the metrics may take a while.