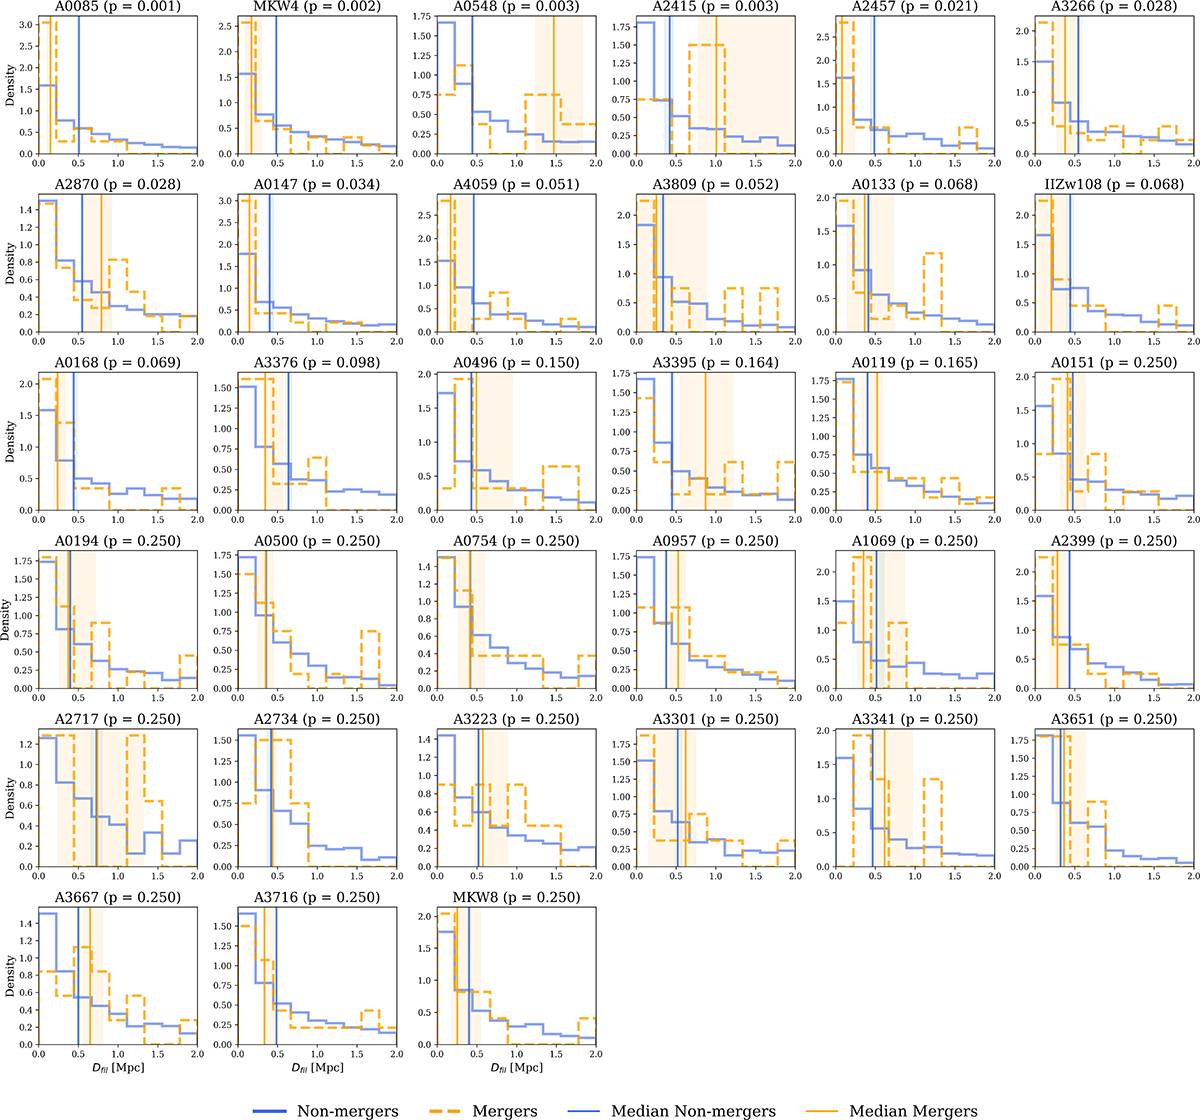
Fig. D.2.
Download original image
Normalised distribution of the nearest distances to filaments for galaxy mergers located outside 1 × R200 in the 33 galaxy clusters (dashed orange line), compared to the non-merging cluster galaxy population outside 1 × R200 of each respective cluster (dotted blue line). Error bars correspond to Poisson uncertainties in each bin, while vertical lines mark the median of each distribution. Shaded regions indicate the 68% bootstrap confidence intervals (percentiles 16–84) around the median. Clusters are ordered from lowest to highest p-value, where a lower p-value indicates stronger evidence of a difference between the distributions. Distances to filaments are truncated at 2 Mpc to emphasise the vicinity where most merger candidates are found, although the full distributions extend up to ∼4 Mpc.
Current usage metrics show cumulative count of Article Views (full-text article views including HTML views, PDF and ePub downloads, according to the available data) and Abstracts Views on Vision4Press platform.
Data correspond to usage on the plateform after 2015. The current usage metrics is available 48-96 hours after online publication and is updated daily on week days.
Initial download of the metrics may take a while.