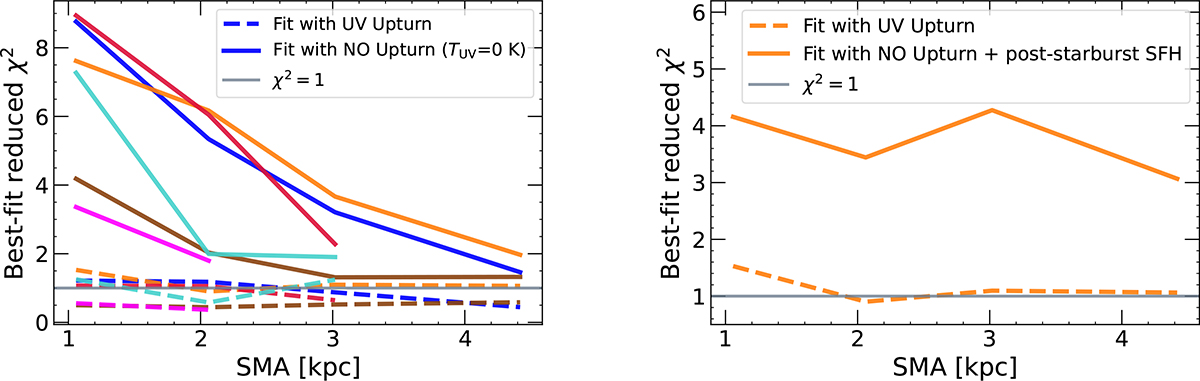
Fig. G.1.
Download original image
Left: Best-fit reduced χ2 as a function of SMA for the galaxies analysed radially. Colours are as in Fig.2. Solid (dashed) lines indicate fits performed without (with) a UV upturn component. Right: As in the left panel, but only for NGC 1272. In this case, the solid line indicates a no Upturn model with the addition of a post-starburst component in the SFH.
Current usage metrics show cumulative count of Article Views (full-text article views including HTML views, PDF and ePub downloads, according to the available data) and Abstracts Views on Vision4Press platform.
Data correspond to usage on the plateform after 2015. The current usage metrics is available 48-96 hours after online publication and is updated daily on week days.
Initial download of the metrics may take a while.