| Issue |
A&A
Volume 708, April 2026
|
|
|---|---|---|
| Article Number | A63 | |
| Number of page(s) | 21 | |
| Section | Extragalactic astronomy | |
| DOI | https://doi.org/10.1051/0004-6361/202558044 | |
| Published online | 26 March 2026 | |
Euclid: Early Release Observations – The star formation history of massive early-type galaxies in the Perseus cluster★
1
Aix-Marseille Université, CNRS, CNES, LAM, Marseille, France
2
INAF – Osservatorio Astronomico di Cagliari, Via della Scienza 5, 09047 Selargius (CA), Italy
3
Université Paris-Saclay, Université Paris Cité, CEA, CNRS, AIM, 91191 Gif-sur-Yvette, France
4
INAF-Osservatorio di Astrofisica e Scienza dello Spazio di Bologna, Via Piero Gobetti 93/3, 40129 Bologna, Italy
5
INAF-Osservatorio Astronomico di Capodimonte, Via Moiariello 16, 80131 Napoli, Italy
6
Dipartimento di Fisica “G. Occhialini”, Università degli Studi di Milano Bicocca, Piazza della Scienza 3, 20126 Milano, Italy
7
INAF-Osservatorio Astronomico di Brera, Via Brera 28, 20122 Milano, Italy
8
Institute of Cosmology and Gravitation, University of Portsmouth, Portsmouth PO1 3FX, UK
9
Sterrenkundig Observatorium, Universiteit Gent, Krijgslaan 281 S9, 9000 Gent, Belgium
10
Université Côte d’Azur, Observatoire de la Côte d’Azur, CNRS, Laboratoire Lagrange, Bd de l’Observatoire, CS 34229, 06304 Nice cedex 4, France
11
Institut universitaire de France (IUF), 1 rue Descartes, 75231 PARIS CEDEX 05, France
12
Laboratoire d’Astrophysique de Bordeaux, CNRS and Université de Bordeaux, Allée Geoffroy St, Hilaire, 33165 Pessac, France
13
Institut d’Astrophysique de Paris, 98bis Boulevard Arago, 75014 Paris, France
14
Instituto de Astrofísica de Canarias, E-38205 La Laguna, Tenerife, Spain
15
Universidad de La Laguna, Dpto. Astrofísica, E-38206 La Laguna, Tenerife, Spain
16
Max Planck Institute for Extraterrestrial Physics, Giessenbachstr. 1, 85748 Garching, Germany
17
Université de Strasbourg, CNRS, Observatoire astronomique de Strasbourg, UMR 7550, 67000 Strasbourg, France
18
Department of Physics and Astronmy, University of Calgary, 2500 University Drive NW, Calgary, Alberta T2N 1N4, Canada
19
Department of Physics & Astronomy, Allen Building, 30A Sifton Rd, University of Manitoba, Winnipeg, MB R3T 2N2, Canada
20
ESAC/ESA, Camino Bajo del Castillo, s/n., Urb. Villafranca del Castillo, 28692 Villanueva de la Cañada, Madrid, Spain
21
IFPU, Institute for Fundamental Physics of the Universe, via Beirut 2, 34151 Trieste, Italy
22
INAF-Osservatorio Astronomico di Trieste, Via G. B. Tiepolo 11, 34143 Trieste, Italy
23
INFN, Sezione di Trieste, Via Valerio 2, 34127 Trieste TS, Italy
24
SISSA, International School for Advanced Studies, Via Bonomea 265, 34136 Trieste TS, Italy
25
Dipartimento di Fisica e Astronomia, Università di Bologna, Via Gobetti 93/2, 40129 Bologna, Italy
26
INFN-Sezione di Bologna, Viale Berti Pichat 6/2, 40127 Bologna, Italy
27
Universitäts-Sternwarte München, Fakultät für Physik, Ludwig-Maximilians-Universität München, Scheinerstr. 1, 81679 München, Germany
28
Dipartimento di Fisica, Università di Genova, Via Dodecaneso 33, 16146 Genova, Italy
29
INFN-Sezione di Genova, Via Dodecaneso 33, 16146 Genova, Italy
30
Department of Physics “E. Pancini”, University Federico II, Via Cinthia 6, 80126 Napoli, Italy
31
Dipartimento di Fisica, Università degli Studi di Torino, Via P. Giuria 1, 10125 Torino, Italy
32
INFN-Sezione di Torino, Via P. Giuria 1, 10125 Torino, Italy
33
INAF-Osservatorio Astrofisico di Torino, Via Osservatorio 20, 10025 Pino Torinese (TO), Italy
34
Institute for Astronomy, University of Edinburgh, Royal Observatory, Blackford Hill, Edinburgh EH9 3HJ, UK
35
Leiden Observatory, Leiden University, Einsteinweg 55, 2333 CC, Leiden, The Netherlands
36
INAF-IASF Milano, Via Alfonso Corti 12, 20133 Milano, Italy
37
Centro de Investigaciones Energéticas, Medioambientales y Tecnológicas (CIEMAT), Avenida Complutense 40, 28040 Madrid, Spain
38
Port d’Informació Científica, Campus UAB, C. Albareda s/n, 08193 Bellaterra (Barcelona), Spain
39
INAF-Osservatorio Astronomico di Roma, Via Frascati 33, 00078 Monteporzio Catone, Italy
40
INFN section of Naples, Via Cinthia 6, 80126 Napoli, Italy
41
Institute for Astronomy, University of Hawaii, 2680 Woodlawn Drive, Honolulu, HI 96822, USA
42
Dipartimento di Fisica e Astronomia “Augusto Righi” – Alma Mater Studiorum Università di Bologna, Viale Berti Pichat 6/2, 40127 Bologna, Italy
43
Jodrell Bank Centre for Astrophysics, Department of Physics and Astronomy, University of Manchester, Oxford Road, Manchester M13 9PL, UK
44
European Space Agency/ESRIN, Largo Galileo Galilei 1, 00044 Frascati, Roma, Italy
45
Université Claude Bernard Lyon 1, CNRS/IN2P3, IP2I Lyon, UMR 5822, Villeurbanne F-69100, France
46
Institut de Ciències del Cosmos (ICCUB), Universitat de Barcelona (IEEC-UB), Martí i Franquès 1, 08028 Barcelona, Spain
47
Institució Catalana de Recerca i Estudis Avançats (ICREA), Passeig de Lluís Companys 23, 08010 Barcelona, Spain
48
Institut de Ciencies de l’Espai (IEEC-CSIC), Campus UAB, Carrer de Can Magrans, s/n Cerdanyola del Vallés, 08193 Barcelona, Spain
49
UCB Lyon 1, CNRS/IN2P3, IUF, IP2I Lyon, 4 rue Enrico Fermi, 69622 Villeurbanne, France
50
Department of Astronomy, University of Geneva, ch. d’Ecogia 16, 1290 Versoix, Switzerland
51
Aix-Marseille Université, CNRS/IN2P3, CPPM, Marseille, France
52
INAF-Istituto di Astrofisica e Planetologia Spaziali, via del Fosso del Cavaliere, 100, 00100 Roma, Italy
53
Space Science Data Center, Italian Space Agency, via del Politecnico snc, 00133 Roma, Italy
54
INFN-Bologna, Via Irnerio 46, 40126 Bologna, Italy
55
University Observatory, LMU Faculty of Physics, Scheinerstr. 1, 81679 Munich, Germany
56
FRACTAL S.L.N.E., calle Tulipán 2, Portal 13 1A, 28231 Las Rozas de Madrid, Spain
57
INAF-Osservatorio Astronomico di Padova, Via dell’Osservatorio 5, 35122 Padova, Italy
58
Institute of Theoretical Astrophysics, University of Oslo, P.O. Box 1029 Blindern 0315 Oslo, Norway
59
Jet Propulsion Laboratory, California Institute of Technology, 4800 Oak Grove Drive, Pasadena, CA 91109, USA
60
Department of Physics, Lancaster University, Lancaster LA1 4YB, UK
61
Felix Hormuth Engineering, Goethestr. 17, 69181 Leimen, Germany
62
Technical University of Denmark, Elektrovej 327, 2800 Kgs. Lyngby, Denmark
63
Cosmic Dawn Center (DAWN), Denmark
64
Max-Planck-Institut für Astronomie, Königstuhl 17, 69117 Heidelberg, Germany
65
NASA Goddard Space Flight Center, Greenbelt, MD 20771, USA
66
Department of Physics and Astronomy, University College London, Gower Street, London WC1E 6BT, UK
67
Department of Physics, P.O. Box 64, University of Helsinki, 00014 Helsinki, Finland
68
Helsinki Institute of Physics, Gustaf Hällströmin katu 2, University of Helsinki, 00014 Helsinki, Finland
69
Laboratoire d’etude de l’Univers et des phenomenes eXtremes, Observatoire de Paris, Université PSL, Sorbonne Université, CNRS, 92190 Meudon, France
70
SKAO, Jodrell Bank, Lower Withington, Macclesfield SK11 9FT, UK
71
Centre de Calcul de l’IN2P3/CNRS, 21 avenue Pierre de Coubertin, 69627 Villeurbanne Cedex, France
72
Dipartimento di Fisica “Aldo Pontremoli”, Università degli Studi di Milano, Via Celoria 16, 20133 Milano, Italy
73
INFN-Sezione di Milano, Via Celoria 16, 20133 Milano, Italy
74
Universität Bonn, Argelander-Institut für Astronomie, Auf dem Hügel 71, 53121 Bonn, Germany
75
INFN-Sezione di Roma, Piazzale Aldo Moro, 2 – c/o Dipartimento di Fisica, Edificio G. Marconi, 00185 Roma, Italy
76
Dipartimento di Fisica e Astronomia “Augusto Righi” – Alma Mater Studiorum Università di Bologna, via Piero Gobetti 93/2, 40129 Bologna, Italy
77
Department of Physics, Institute for Computational Cosmology, Durham University, South Road, Durham DH1 3LE, UK
78
Institut d’Astrophysique de Paris, UMR 7095, CNRS, and Sorbonne Université, 98 bis boulevard Arago, 75014 Paris, France
79
Institute of Physics, Laboratory of Astrophysics, Ecole Polytechnique Fédérale de Lausanne (EPFL), Observatoire de Sauverny, 1290 Versoix, Switzerland
80
Telespazio UK S.L. for European Space Agency (ESA), Camino bajo del Castillo, s/n, Urbanizacion Villafranca del Castillo, Villanueva de la Cañada, 28692 Madrid, Spain
81
Institut de Física d’Altes Energies (IFAE), The Barcelona Institute of Science and Technology, Campus UAB, 08193 Bellaterra (Barcelona), Spain
82
European Space Agency/ESTEC, Keplerlaan 1, 2201 AZ, Noordwijk, The Netherlands
83
DARK, Niels Bohr Institute, University of Copenhagen, Jagtvej 155, 2200 Copenhagen, Denmark
84
Waterloo Centre for Astrophysics, University of Waterloo, Waterloo, Ontario N2L 3G1, Canada
85
Department of Physics and Astronomy, University of Waterloo, Waterloo, Ontario N2L 3G1, Canada
86
Perimeter Institute for Theoretical Physics, Waterloo, Ontario N2L 2Y5, Canada
87
Centre National d’Etudes Spatiales – Centre spatial de Toulouse, 18 avenue Edouard Belin, 31401 Toulouse Cedex 9, France
88
Institute of Space Science, Str. Atomistilor, nr. 409 Măgurele, Ilfov 077125, Romania
89
Dipartimento di Fisica e Astronomia “G. Galilei”, Università di Padova, Via Marzolo 8, 35131 Padova, Italy
90
INFN-Padova, Via Marzolo 8, 35131 Padova, Italy
91
Institut für Theoretische Physik, University of Heidelberg, Philosophenweg 16, 69120 Heidelberg, Germany
92
Institut de Recherche en Astrophysique et Planétologie (IRAP), Université de Toulouse, CNRS, UPS, CNES, 14 Av. Edouard Belin, 31400 Toulouse, France
93
Université St Joseph; Faculty of Sciences, Beirut, Lebanon
94
Departamento de Física, FCFM, Universidad de Chile, Blanco Encalada 2008 Santiago, Chile
95
Institut d’Estudis Espacials de Catalunya (IEEC), Edifici RDIT, Campus UPC, 08860 Castelldefels, Barcelona, Spain
96
Satlantis, University Science Park, Sede Bld 48940, Leioa-Bilbao, Spain
97
Institute of Space Sciences (ICE, CSIC), Campus UAB, Carrer de Can Magrans, s/n, 08193 Barcelona, Spain
98
Department of Physics and Helsinki Institute of Physics, Gustaf Hällströmin katu 2, University of Helsinki, 00014 Helsinki, Finland
99
Departamento de Física, Faculdade de Ciências, Universidade de Lisboa, Edifício C8, Campo Grande, PT1749-016 Lisboa, Portugal
100
Instituto de Astrofísica e Ciências do Espaço, Faculdade de Ciências, Universidade de Lisboa, Tapada da Ajuda, 1349-018 Lisboa, Portugal
101
Mullard Space Science Laboratory, University College London, Holmbury St Mary, Dorking, Surrey RH5 6NT, UK
102
Cosmic Dawn Center (DAWN)
103
Niels Bohr Institute, University of Copenhagen, Jagtvej 128, 2200 Copenhagen, Denmark
104
Universidad Politécnica de Cartagena, Departamento de Electrónica y Tecnología de Computadoras, Plaza del Hospital 1, 30202 Cartagena, Spain
105
Caltech/IPAC, 1200 E. California Blvd., Pasadena, CA 91125, USA
106
Astronomisches Rechen-Institut, Zentrum für Astronomie der Universität Heidelberg, Mönchhofstr. 12-14, 69120 Heidelberg, Germany
107
Instituto de Física Teórica UAM-CSIC, Campus de Cantoblanco, 28049 Madrid, Spain
108
Aurora Technology for European Space Agency (ESA), Camino bajo del Castillo, s/n, Urbanizacion Villafranca del Castillo, Villanueva de la Cañada, 28692 Madrid, Spain
109
Zentrum für Astronomie, Universität Heidelberg, Philosophenweg 12, 69120 Heidelberg, Germany
110
ICL, Junia, Université Catholique de Lille, LITL, 59000 Lille, France
★★ Corresponding author: This email address is being protected from spambots. You need JavaScript enabled to view it.
Received:
10
November
2025
Accepted:
26
January
2026
Abstract
The Euclid Early Release Observations (ERO) programme targeted the Perseus galaxy cluster in its central region over 0.7 deg2. We combined the exceptional image quality and depth of the ERO-Perseus with FUV and NUV observations from GALEX and AstroSat/UVIT, as well as ugrizHα data from MegaCam at the CFHT, to deliver FUV-to-NIR magnitudes of the 87 brightest galaxies within the Perseus cluster. We reconstructed the star formation history (SFH) of 59 early-type galaxies (ETGs) within the sample, through the spectral energy distribution (SED) fitting code CIGALE and state-of-the-art stellar population (SP) models to reproduce the galactic UV emission from hot, old, low-mass stars (i.e. the UV upturn). In addition, for the six most massive ETGs in Perseus [stellar masses log10(M*/M⊙)≥10.3], we analysed their spatially resolved SP and SFH through a radial SED fitting. In agreement with our previous work on Virgo ETGs, we found that (i) the majority of the analysed galaxies needs the presence of a UV upturn component to explain their FUV emission, with average temperatures ⟨TUV⟩≃33 800 K; (ii) the ETGs of Perseus have grown their stellar masses quickly, with star formation timescales of τ ≲ 1500 Myr. We found that all ETGs in the sample have formed more than about 30% of their stellar masses at z ≃ 5, up to extreme fractions of ≃100%. At z ≃ 5, the stellar masses of the most massive nearby ETGs, which have present-day stellar masses of log10(M*/M⊙)≳10.8, are then found to be comparable to those of the red quiescent galaxies observed by JWST at similar redshifts (z > 4.6). This study can be extended to ETGs in the 14 000 deg2 extragalactic sky that will soon be observed by Euclid, in combination with those from other major upcoming surveys (e.g. Rubin/LSST), and UV observations, to ultimately assess whether the massive ETGs that we observe today represent the progeny of the massive high-z JWST red quiescent galaxies.
Key words: galaxies: clusters: general / galaxies: elliptical and lenticular / cD / galaxies: evolution / galaxies: interactions / galaxies: clusters: individual: Perseus / galaxies: stellar content
This paper is published on behalf of the Euclid Consortium.
© The Authors 2026
 Open Access article, published by EDP Sciences, under the terms of the Creative Commons Attribution License (https://creativecommons.org/licenses/by/4.0), which permits unrestricted use, distribution, and reproduction in any medium, provided the original work is properly cited.
This article is published in open access under the Subscribe to Open model. This email address is being protected from spambots. You need JavaScript enabled to view it. to support open access publication.
1. Introduction
The formation and evolution of red and quiescent massive galaxies at different cosmic epochs is still far from understood. At high redshifts, recent results from the James Webb Space Telescope (JWST) have shown that red galaxies are already very massive, with stellar masses of log10(M*/M⊙) > 10 at z > 3 (e.g. Baggen et al. 2023; Carnall et al. 2023, 2024; Valentino et al. 2023; Labbé et al. 2023; Boyett et al. 2024; Glazebrook et al. 2024; Casey et al. 2024; Antwi-Danso et al. 2025; Baker et al. 2025a,b; Nanayakkara et al. 2025; Toni et al. 2026), and that they formed and quenched with extreme star formation (SF) timescales (e.g. Δt ∈ [100, 500] Myr, representing here the duration of the SF burst for several parametrisations of the SF history, SFH, de Graaff et al. 2025). These observations are difficult to reconcile with predictions from hydrodynamical cosmological simulations (e.g. Lovell et al. 2023; Kimmig et al. 2025) and from galaxy formation and evolution scenarios (e.g. Oser et al. 2010; De Lucia et al. 2024; Lagos et al. 2025), which rather predict a late formation of massive objects, posing challenges to the Λ-cold-dark-matter cosmological model (e.g. Menci et al. 2022; Boylan-Kolchin 2023).
To shed light on this issue, one approach is to reconstruct the SFH of nearby, local massive early-type galaxies (ETGs), which we can observe in much more detail and with deeper observations. Indeed, such systems are red, old, and have little or no ongoing SF, resembling the high-z galaxies observed by JWST. In addition, local massive ETGs are observed to be metal-rich and the most abundant in [α/Fe] elements, which indicates that they must have formed rapidly (e.g. Worthey et al. 1992; Trager et al. 2000; Thomas et al. 2005; Greene et al. 2013). As was discussed in Thomas et al. (2005), these results imply that quiescent massive galaxies with very high stellar masses should be present between redshifts 2 and 5, a prediction now confirmed by JWST. Nearby, local ETGs are indeed thought to form through a two-phase scenario (Oser et al. 2010). In the first phase, rapid in situ SF occurs, fueled by the infall of cold gas (at z > 2), to explain the high metallicities and α abundances. To account for the difference in size among high- and low-redshift galaxies (Daddi et al. 2005), it is expected that a second phase is dominated by mass growth through dissipationless mergers (minor or major or both, occurring at later stages, z < 2). Connecting the populations of galaxies across different redshifts then provides fundamental insights into galaxy formation theories, as the properties of nearby ETGs are so similar to those of red and quiescent galaxies at high-z that they might represent their descendants.
A particular class of galaxies increasingly recognised as the direct descendants of massive red quiescent galaxies at high redshift are the so-called relic galaxies (e.g. Trujillo et al. 2014; Ferré-Mateu et al. 2017; Yıldırım et al. 2017; Spiniello et al. 2024; Tortora et al. 2025). These systems are believed to have remained largely untouched by mergers over cosmic time, and thus to have retained the properties of their likely high-z progenitors. They are characterised by very old stellar populations (SP, ≳10 Gyr), compact sizes (Reff ≲ 2 kpc, Buitrago et al. 2008), and strong α enhancements ([α/Fe] ≳ 0.4 dex; Trujillo et al. 2014; Ferré-Mateu et al. 2015, 2017). In some cases, they show only a single, red globular cluster (GC) population (Beasley et al. 2018), indicative of the absence of accretion from dwarf satellites.
The question we pose here is whether there exist ETGs in the local Universe (and if so, how many) whose SFH is consistent with that of the red quiescent galaxy population observed by JWST at high-z. In this context, we started an observational campaign that aimed to reconstruct the SFH of massive ETGs in local galaxy clusters thanks to a multi-wavelength radial analysis coupled with state-of-the-art SP models (Martocchia et al. 2025). Galaxy clusters provide ideal laboratories for the study of massive ETGs, as these galaxies are mainly found in such rich and dense environments (e.g. Dressler 1980), suggesting that environment strongly shapes the evolution of galaxies (e.g. Thomas et al. 2010; La Barbera et al. 2012; Boselli et al. 2014; Pasquali et al. 2019). In Martocchia et al. (2025), we reconstructed the SFH of seven massive ETGs within Virgo, our closest galaxy cluster, through a radial spectral energy distribution (SED) fitting analysis with the CIGALE code (Code Investigating GALaxy Evolution, e.g. Burgarella et al. 2005; Noll et al. 2009; Boquien et al. 2019). We recovered the properties of their spatially resolved SPs and we find that these galaxies assembled their stellar mass extremely rapidly, consistent with what is found by JWST at high-z. In this study, we stress the importance of a multi-wavelength approach in the reconstruction of the galaxies’ SFHs. Originally thought to be simple, spheroidal, pressure-supported systems, most ETGs are now known to be fast rotators (FRs; e.g. Emsellem et al. 2011). They can also host gas in both molecular and ionised phases (e.g. Serra et al. 2012; Young et al. 2014), exhibit X-ray and radio emission from a central active galactic nucleus (AGN), and display strong UV emission from hot, old, low-mass stars in late evolutionary stages – the so-called UV upturn phenomenon (e.g. Code & Welch 1979; O’Connell 1999).
Additionally, within ETGs, which usually host a limited amount of dust and gas, it is also imperative to have access to deep and high-angular-resolution data to detect small-scale and faint galactic components at different wavelengths. In these studies, Euclid observations (Euclid Collaboration: Mellier et al. 2025; Euclid Collaboration: Cropper et al. 2025; Euclid Collaboration: Jahnke et al. 2025) represent a major asset: the unprecedented data quality offered by Euclid both in the visible and NIR will, in the next few years, provide sharp and deep images of local massive ETGs in 14 000 deg2 of the extragalactic sky. This will enable the characterisation of their morphology, the discovery of shells, tidal tails (indicative of merger events, e.g. Sola et al. 2025), and the presence of gas and dust structures, and the study of the intracluster light (Kluge et al. 2025) and their SFHs (Euclid Collaboration: Kovačić et al. 2025; Euclid Collaboration: Abdurro’uf et al. 2025; Euclid Collaboration: Nersesian et al. 2026). Euclid observations, combined with surveys such as the Vera Rubin Observatory Legacy Survey of Space and Time (Rubin/LSST) in the optical, with the Ultraviolet Near Infrared Optical Northern Survey (UNIONS, Ibata et al. 2017), with AstroSat in the far- and near-UV (and in the next decade, with the CASTOR and UVEX missions, Côté et al. 2025 and Kulkarni et al. 2021), will ultimately be able to probe the properties of a statistically significant sample of massive nearby ETGs in galaxy clusters of different masses and dynamical states.
Here we use the Euclid Early Release Observations (ERO, Euclid Early Release Observations 2024) of the Perseus cluster, in combination with other high-spatial-resolution multi-wavelength observations of the same field, to reconstruct the SFH of the most massive ETGs in Perseus. The Perseus cluster is one of the most massive galaxy clusters in the local Universe, located at a distance of ≃72 Mpc, dynamically older than Virgo. It has also been found to host the most promising local candidate of a relic galaxy, NGC 1277 (Trujillo et al. 2014), together with many other compact ETGs. Despite being one of the most studied nearby clusters, the wide field of view (0.7 deg2, Cuillandre et al. 2025b), high spatial resolution, and low background of the Euclid ERO provide the first high-resolution, full-cluster view of Perseus from the optical to the NIR. We combine this unique dataset with (i) images in the NUV and FUV from the UltraViolet Imaging Telescope (UVIT) on board the AstroSat satellite (Agrawal 2006), (ii) NUV and FUV observations from GALEX, and (iii) optical ugrizHα images taken with MegaCam at the Canada-France-Hawaii-Telescope (CFHT). We provide integrated FUV-to-NIR magnitudes of the 87 brightest galaxies in Perseus. For 59 ETGs of the sample, we reconstruct their SFH from their integrated SEDs, while we report a radial SP analysis and SED fitting for six of the most massive ETGs in the sample.
This paper is structured as follows. Sect. 2 reports information on the data used, while Sect. 3 describes the data analysis. In Sect. 4 we outline the SED fitting analysis and in Sect. 5 we report on the results. Finally, we discuss in Sect. 6 and conclude in Sect. 7. Throughout the paper, we use the AB magnitude reference system.
2. Observations and data reduction
2.1. Euclid ERO images
The analysis presented in this paper is based on a set of multi-wavelength data of the Perseus cluster, based on the region imaged by the Euclid ERO (Cuillandre et al. 2025a,b). The Perseus cluster was imaged by Euclid during the science verification phase in September 2023 (Cuillandre et al. 2025a), with a reference observing sequence (ROS, Euclid Collaboration: Scaramella et al. 2022). The ERO images consist of four ROSs, each one with four dithered exposures of 566 s each in the IE filter (with effective wavelength λeff = 7171 Å), and four dithered exposures of 87.2 s each in the YE, JE, HE filters (λeff = 10 809, 13 673, 17 714 Å, Euclid Collaboration: Schirmer et al. 2022; Euclid Collaboration: Cropper et al. 2025; Euclid Collaboration: Jahnke et al. 2025). For the specific passband curves, as well as for the data reduction procedures we refer to Cuillandre et al. (2025b). The pixel sizes of the IE image is  , while it is
  for the NIR dataset (YE, JE, HE); the full width at half maximum (FWHM) of the final IE, YE, JE, HE science stacks measures
  ,
,  ,
,  , and
, and  , respectively. The dataset reaches a surface brightness limit of 30 (29.2) AB mag arcsec−2 for the IE (YE, JE, HE) band, excellent for the detection of low surface brightness (LSB) features such as shells and tidal tails formed during the gravitational interaction of galaxies with surrounding objects (e.g. Duc et al. 2015; Mancillas et al. 2019; Sola et al. 2022).
2.2. UV imaging: GALEX and AstroSat/UVIT
In the UV regime, we downloaded already reduced images centred on NGC 1275 from the GALEX1 and AstroSat/UVIT2 archives. Table 1 reports information on the collected UV datasets. We performed stacks of the long and short exposures of the GALEX images. The reached FWHM of the GALEX FUV and NUV images is  –
– , respectively (Morrissey et al. 2007)3, while it is
  –
– ,
,  –
– , for the AstroSat/UVIT images in the FUV and NUV bands, respectively (Tandon et al. 2020). The reached surface brightness limits are 28.0 and 27.93 AB mag arcsec−2 for the UVIT FUV and NUV dataset, while they are 26.4 and 26.1 AB mag arcsec−2 for the GALEX FUV and NUV images, respectively.
Main information on the archival GALEX and AstroSat/UVIT images centred on the Perseus cluster used in this work.
We used both GALEX and UVIT images to estimate the integrated fluxes and magnitudes of the Perseus galaxies in the FUV and NUV bands. We report the results for the GALEX bands in the main text of the paper (Sect. 3.1), as GALEX observations cover almost the entire Euclid ERO footprint. In Appendix C, we report on the comparison between the GALEX and UVIT magnitudes, see Sect. 3.1 for more details. UVIT images, thanks to their unprecedented spatial resolution in the UV, were mainly used for the spatially resolved analysis of the SPs within the most massive ETGs of the Perseus cluster (see Sect. 3.3).
2.3. CFHT-MegaCam images
We used optical images from the MegaCam at the CFHT (Cuillandre et al. 2025b) which observed the Perseus cluster with a similar footprint of the Euclid images in the u, g, r, i, and z third-generation filters, at λeff ≃ 3682, 4784, 6397, 7695, 8987 Å, respectively, as well as with an Hα narrow-band filter (the ‘off’ filter, CFHT ID 9604), centred on λeff = 6719 Å, with a Δλ = 109 Å. At the redshift of these galaxies, this filter includes the Hα line together with the two N II lines at λ = 6548, 6583 Å. Hereafter, we refer to the filter simply as Hα, unless otherwise stated. We refer to Cuillandre et al. (2025b) for details on the dataset information and data reduction process. The mean FWHM of the stacked ugrizHα images is  ,
,  ,
,  ,
,  ,
,  ,
,  , respectively.
For this work, we generated stellar-continuum-subtracted Hα images, which are named NET_Hα images hereafter. These images were used to check for contamination from young stars or recent SF in the Perseus galaxies. This step is particularly critical for ETGs where the emission of ionised gas is marginal compared to the emission of stars. As in Boselli et al. (2019, 2022), the stellar continuum was estimated by combining the r-band image with a g − r colour map. Given the difference between the width and central transmission wavelength of the r filter with respect to the narrow-band Hα filter, the derivation of the stellar continuum depends on the spectral properties of the emitting source (Spector et al. 2012), thus on its colour. As in Boselli et al. (2018), we used ≃50 000 unsaturated stars with SDSS available spectroscopy to derive their magnitudes in the g, r, and Hα filters and calibrate an empirical relation between the colour of the stars and the continuum. We obtained
![Mathematical equation: $$ \begin{aligned} \mathrm{Cont\_}{\mathrm{H} \alpha }\,\mathrm{[mag]} = r - 0.1123\,(g-r) - 0.0025. \end{aligned} $$](/articles/aa/full_html/2026/04/aa58044-25/aa58044-25-eq19.gif) (1)
(1)
This normalisation was applied pixel by pixel, only where S/N > 1, to avoid the introduction of any extra noise in the sky regions where no stellar continuum is present. We subtracted the normalised stellar continuum from the Hα images pixel by pixel and we finally multiplied the continuum-subtracted image by the filter width (Δλ = 109 Å), in order to obtain a flux from a flux density. We report the continuum-subtracted Hα image of NGC 1275 in the Appendix, Fig. A.1. The average unbinned sensitivity is Σ(Hα)≃4 × 10⁻¹⁷ erg s−1 cm−2 arcsec−2 at 1σ. Since the contribution of the stellar continuum is derived using the r and g − r images, artefacts might be artificially created in those regions where the emission is strongly peaked and colour gradients are present, which typically happens in the core of bright ellipticals (e.g. Boselli et al. 2019, see also Martocchia et al. 2025). This might produce major effects in the resulting continuum-subtracted images. Any possible emission in these particular regions must be confirmed with spectroscopic data (see Sects. 2.4 and 4.2 for more details on the analysis of the ionised gas emission).
2.4. Supplementary data
For the six targeted galaxies on which we performed the radial SP analysis (see Sect. 3.3), we checked their ionised nuclear gas emission. Thus, we downloaded SDSS optical spectra for NGC 1270, NGC 1281 and WISEAJ031922_39+412545_6; for NGC 1277 and NGC 1278, we downloaded optical spectra from the CfA survey (Falco et al. 1999) to inspect for the presence of emission lines (Hα, Hβ, O III) in the nuclei, where the CFHT Hα images might be contaminated by artefacts (see Sects. 2.3 and 4.2, for more details). For NGC 1272, no optical spectrum is available in the literature, to the best of our knowledge.
We also downloaded images of the targeted galaxies in the infrared (IR) to estimate their dust masses (see Sect. 4.3). We downloaded Spitzer/IRAC level 2 images from the Spitzer Heritage Archive4 (channels I1, I2, I3, and I4 where available, from 3.5 to 8 μm) as well as WISE images from the IRSA/IPAC website in the bands W1, W2, W3, W4 (3.5, 4.6, 12, 22 μm)5. We checked for far-IR (FIR) data of the targeted galaxies but only images from the Infrared Astronomical Satellite (IRAS) are available, with an angular resolution of > 100″ at λ > 60 μm, and thus not usable for our purpose.
3. Data analysis
3.1. Integrated UV magnitudes of Perseus galaxies
We selected the 200 brightest galaxies in the IE magnitude from the catalogue of Perseus galaxy members by Cuillandre et al. (2025b). We defined circle regions6 in the FUV band, by using a radius equal to the reported effective radius Reff in the IE band by Cuillandre et al. (2025b). We note that this is a Reff, maj, and thus it represents the semi-major axis (SMA) of the isophote that includes 50% of the flux and it is not circularised. We refer to Reff, maj as Reff hereafter. If the obtained circle region did not include all the FUV flux, the radius was increased or decreased manually, until the flux distribution of pixels homogeneously drops to zero. We also checked the aperture edges in the IE image, to make sure that the aperture was not extended too far and that it does not include a nearby source, as was done in Voyer et al. (2014). For the GALEX bands, we kept radii ≥ 0.5 FWHM ( ). For two irregular galaxies, namely PGC012358 and UGC02665, we used an elliptical region. We then estimated the fluxes and magnitudes of such galaxies in each of the available bands (from FUV to HE). Errors at 1σ on fluxes and magnitudes are calculated as in Martocchia et al. (2025), after masking all the images for foreground and background sources, and spikes produced by saturated stars. The background noise for each galaxy is estimated by averaging the flux of 1000 regions (with the same shape of each original region), each one generated with a random position in the ERO-Perseus field of view of each image.
We corrected the derived fluxes for the Milky Way extinction by assigning a colour excess, E(B − V), to each galaxy (see Cuillandre et al. 2025b) from the Planck 2013 dust opacity map (Planck Collaboration XI 2014), and by using the extinction curve by Gordon et al. (2023), with RV = 3.1. For the extinction correction, we followed the prescriptions reported in Cuillandre et al. (2025b), their Sect. 3.3 (see also Marleau et al. 2025). We kept all sources with S/N ≥ 3 in both FUV and NUV bands. In Table B.1, we list the FUV and NUV magnitudes of all sources within the GALEX and UVIT field of view identified within the Euclid footprint. In total, we identified 87 Perseus galaxies in the Euclid footprint from the GALEX images (28 from UVIT) with a S/N ≥ 3 in all considered bands. Concerning the integrated study, we refer to FUV and NUV magnitudes from GALEX, hereafter.
3.2. Colour comparison between Virgo and Perseus clusters
We explore here UV and optical colours trends, as the FUV − IE represents a pure comparison among hot stars, which are strong emitters in the FUV, and old cool stars, which are emitters in the optical, red bands. The FUV − NUV colour is instead an indication of the UV slope of the SED of galaxies. This colour has been largely considered in the literature as an empirical indicator of the UV upturn, because, when FUV − NUV < 1, the UV slope in the SED increases for decreasing wavelengths (Yi et al. 2011). However, this threshold depends on the assumed models and SFH, and it can occur that the UV emission from old stellar populations is also present when FUV − NUV > 1. Nevertheless, the FUV − NUV colour is sensitive to different effects (Smith et al. 2012), among which main sequence turn-off stars, due to strong metalline blanketing in the NUV (Donas et al. 2007). Here we make general considerations on the colour trends, and we refer to later Sections for the identification of the UV upturn in these galaxies in comparison with the models used in this work. Figure 1 shows the FUV − NUV (left) and FUV − IE (right) colours as a function of stellar mass for galaxies in the Perseus and Virgo clusters. Stellar masses of Perseus galaxies are from Cuillandre et al. (2025b), which are calculated with a Chabrier IMF (Chabrier 2003) and the Bruzual & Charlot (2003) SP models. Data for the Virgo galaxies are from the GALEX Ultraviolet Virgo Cluster Survey (GUViCS, Voyer et al. 2014 and Boselli et al. 2014). To retrieve the IE magnitudes for the Virgo galaxies, we first converted the CFHT/MegaCam filters from the second (Virgo) to the third (Perseus) generation7. Next, the CFHT i magnitudes were transformed to the IE band with a linear regression, as is done in Cuillandre et al. (2025b).
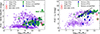 |
Fig. 1. FUV − NUV (left) and FUV − IE (right) colours as a function of stellar mass for the Perseus galaxies studied in this work and for the Virgo galaxies from the GUViCS data (Voyer et al. 2014; Boselli et al. 2014). Filled green squares (diamonds) indicate Perseus ETGs (unclassified) sources from Meusinger et al. (2020). Filled blue diamonds are Perseus LTGs, while the open red circle represents the central galaxy of Perseus, namely NGC 1275. Purple open triangles indicate Virgo LTGs, while Virgo ETGs are represented by purple open stars. M87, the central of Virgo, is also highlighted with an open red square. Black dashed lines are the magnitude limit curves for each corresponding colour for the Perseus observations. Circular apertures are defined in the FUV band starting with a radius equal to the Reff in IE by Cuillandre et al. (2025b). Apertures were adjusted when needed to fully encompass the FUV emission, and checked against the IE images to avoid contamination, as in Voyer et al. (2014). We refer to Sect. 3.1 for more details. |
Overall, in both panels, we observe that the Perseus ETGs and LTGs occupy a narrower part of the diagram compared to Virgo galaxies. We note that we are sampling the central regions of the Perseus cluster (one-fourth of the virial radius, Cuillandre et al. 2025b) while the Virgo GUViCS survey extends up to twice the virial radius, although it does not cover the entire extension of the cluster in the FUV. Therefore, we also examined Fig. 1 considering only the galaxies located within the inner one-fourth of the Virgo cluster’s virial radius. In this case, we note that the number of LTGs in Virgo is drastically reduced, as expected (Whitmore et al. 1993), showing that the bluest LTGs in Virgo are mainly further away from the cluster centre, where the density of the intracluster medium (ICM) is at its maximum and has likely transformed blue galaxies into red ones due to environmental processes (Boselli et al. 2014).
Additionally, we observe that the Perseus and Virgo LTGs have quite different colours, with the Perseus LTGs being much redder in FUV − NUV, comparable to those of ETGs in both clusters8. Therefore, we visually inspected the Perseus LTGs in the IE images. We find that only two of them are discs or spirals showing clumps and knots, indicative of the likely presence of gas and thus ongoing SF. The remaining LTGs are either spirals or discs lacking a clear clumpy structure, and are likely gas-deficient systems (Mondelin et al. 2025, see their Fig. 3 for a snaphot of these galaxies). To the best of our knowledge, no H I data are available for these galaxies to perform a quantitative analysis of their gas deficiency (e.g. Boselli & Gavazzi 2009). The two gas-rich galaxies are UGC02665 and MCG+07-07-070, both of which are jellyfish galaxies known to be undergoing ram-pressure stripping (RPS) events (Roberts et al. 2022; George et al. 2025). They also correspond to the LTGs in our sample with the bluest FUV − NUV colours, FUV − NUV < 0.5 in Fig. 1. It is therefore likely that the redder Perseus LTGs have been quenched due to RPS. A comparison between RPS models and FUV − NUV colours in the Virgo cluster was presented by Boselli et al. (2014, their Fig. 11). The models predict a reddening of FUV − NUV depending on the lookback time, accompanied by quenching of SF. The colour difference between Virgo and Perseus LTGs can then be explained by the higher efficiency of RPS in Perseus. The RPS efficiency depends on the ICM density and the velocity dispersion (RPS = ρICMv2). Using velocity dispersions from Boselli & Gavazzi (2006) and Kang et al. (2024), and ICM densities from Urban et al. (2011) and Simionescu et al. (2011) within radii ∈[0, 0.6] Mpc, we find that the RPS in Perseus is a factor of ≃2 higher than that in Virgo.
Concerning the ETGs, we observe that at masses lower than log10(M*/M⊙)≲10, many Virgo ETGs are redder in FUV − NUV and in FUV − IE, while this population is apparently not observed in Perseus. This is most likely due to the fact that Perseus is further away than Virgo (72 Mpc vs. 16 Mpc), hence the redder, lower-mass (thus, lower luminosity) galaxies are not detected in the UV bands. This is shown by the magnitude limit curves plotted in Fig. 1 as black dashed lines for the Perseus observations9. NGC 1265 (labeled in Fig. 1), as well as the other ETG at log10(M*/M⊙)≃8.1 are very red outliers. However, this is most likely due to the contamination of bright foreground stars that happens to lie at a projected distance of a few arcseconds from the centre of both galaxies. Both M 87 and NGC 1275 are quite blue, with UV slopes comparable to the bluest ETGs in both clusters, at similar stellar masses [log10(M*/M⊙) > 11]. This result is unsurprising, as both systems are the brightest cluster galaxies (BCGs) located at the centers of Virgo and Perseus, respectively, and therefore represent exceptional objects (Conselice et al. 2001; Boselli et al. 2019).
Also, the Virgo and Perseus galaxies follow similar FUV − IE colours, when taking into account the magnitude limits. Overall, ETGs are redder and more confined in FUV − IE colours with respect to the LTGs, which span a wider range of FUV − IE colours. This is true except for the two BCGs. NGC 1275 is extremely blue with a FUV − IE ≃ 4, comparable to the LTGs in both clusters. M 87 is also among the bluest of the ETGs sample. Again, we observe how LTGs in Virgo are bluer and much more numerous with respect to Perseus LTGs, at similar stellar masses, whose FUV − IE colours are overall comparable to the ETGs. Among the LTGs of Perseus, three galaxies are very blue, with FUV − IE < 4, namely UGC02665, WISEAJ032010_12+412104_2 and MCG+07-07-070, among which we find the two jellyfish galaxies mentioned above. WISEAJ032010_12+412104_2 is also known as LEDA 12468, which has not been studied in detail so far. It appears as an elliptical galaxy, possibly with some faint discy gas emission, which needs to be confirmed with further analysis. Within this sample, we selected 59 ETGs in Perseus to perform a SED fitting analysis with CIGALE (Sect. 4) by using the integrated fluxes reported in Tables B.1 and B.2. We excluded NGC 1275 for its cooling flow from this sample as well (see Fig. A.1). We refer to this sample as the integrated sample, hereafter.
3.3. Radial analysis
For the radial analysis, we used the AstroSat/UVIT images in the FUV and NUV, given their higher spatial resolution ( ) with respect to the GALEX images. We selected those ETGs (from Table B.1) that have a S/N ≥ 7 both in the UVIT FUV and NUV bands10. After this selection, we are left with 8 galaxies. Next, we followed the analysis described in Martocchia et al. (2025), briefly summarised below; for further details, we refer the reader to that work. Isophotal fitting was performed for each target galaxy on the IE images. The resulting isophotes were applied to all bands to derive fluxes in radial bins, using WCS coordinates to account for the differing image resolutions. Fits were carried out with the ellipse algorithm (Jedrzejewski 1987) implemented in photutils (Bradley et al. 2023). The position angle of successive ellipses was left free, as fixing it failed to reproduce galaxies with twisting isophotes. The isophote fit was then performed on consecutive ellipses of pre-defined SMAs, starting from a SMA = 3″, and with a step of ΔSMA = 3″.
For the following radial analysis, we kept all galaxies that have at least three elliptical consecutive regions with S/N ≥ 3 in the FUV band. The final list of the radially analysed ETGs is reported in Table 2, along with their main properties. This consists of seven galaxies, some of which are well known and studied in the literature. Among these, we have two extended galaxies, NGC 1272 and NGC 1278, as well as four compact galaxies (Reff ≲ 3 kpc), including the well-studied relic galaxy NGC 1277. We refer to Appendix D for a more detailed description on each individual galaxy within the radial sample.
Properties of the Perseus galaxies analysed radially.
Based on the work by Vigneron et al. (2024), we masked the inner regions of the BCG NGC 1275 out to a radius of 2.6 kpc from the centre of the galaxy, as the emission is dominated by the strong AGN and its nuclear activity. It is also well known that NGC 1270, 1271, 1272, 1277, 1278, and 1281 host an AGN in their centre, mostly in the form of peculiar very massive black hole (see Table 2, and references therein). This was also recently confirmed by radio and X-ray observations (Santra et al. 2007; Park et al. 2017; Gendron-Marsolais et al. 2021; Saglia et al. 2024), while the AGN presence is not evident from the optical and IR parts of the nuclear spectra, where no significant emission lines are observed (e.g. Sakai et al. 2012; Park et al. 2017). These galaxies are indeed low-luminosity AGNs, the nuclear optical-IR spectra of which are dominated by the stellar activity. Hence, we do not expect a significant contribution from the AGN activity in the centre of these galaxies. However, as we are not able to disentangle the AGN UV emission from the one coming from the old stars, we masked the central region of these six galaxies (with 1″ radius, corresponding to ≃350 pc at the distance of Perseus) for both the integrated and radial analyses.
Figure 2 shows the FUV − NUV (left) and FUV − IE (right) colours as a function of the SMA of the considered ellipse region for both Perseus and Virgo galaxies (from Martocchia et al. 2025)11. Overall, the radial profiles are similar among the two clusters. As the right panel of Fig. 2 shows, NGC 1275 is very blue compared to the other ETGs, most likely due to the presence of young blue star clusters and young massive stars (Conselice et al. 2001; Canning et al. 2014; Tremblay et al. 2015). For this reason, we discarded NGC 1275 from the following SP analysis, as the presence of multi-phase gas and powerful AGN activity could hamper the interpretation of our results.
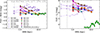 |
Fig. 2. FUV − NUV (left) and FUV − IE (right) colours as a function of the semi-major axis in kiloparsecs. The empty symbols indicate the values of the central colours calculated when a mask is not applied. The dotted lines connect the central unmasked regions to the successive regions. See Sect. 3.3 for more details. The Perseus ETGs are indicated with solid lines, while the Virgo ETGs from Martocchia et al. (2025) are represented by dashed lines and purple colours. The vertical dash-dotted grey line indicates the projected radius within which a disc of dust is observed in the IE images of NGC 1270, NGC 1277, NGC 1278, and NGC 1281, see Sect. 4.3. |
3.4. Galaxy morphology with Euclid
Thanks to the unprecedented depth and high angular resolution of the Euclid observations, we were able to observe that four galaxies within the radial sample hosted a disc in their inner regions, at 0.1 ≲ SMA/Reff ≲ 0.2, likely dusty discs or rings which might be either due to the presence of an AGN (e.g. Park et al. 2017) or similar to the nuclear discs observed in barred disc galaxies (e.g. Gadotti & de Sá-Freitas 2025). The vertical lines in Fig. 2 represent the projected distance from the centre within which the disc is observed. We discuss the disc analysis in Sect. 4.3, in connection with the CIGALE SED fitting analysis.
In addition, we checked for LSB features in the surroundings of the galaxies in the radial sample, which might represent an indication of recent major or minor mergers, as well as gravitational interactions that galaxies underwent (e.g. Mancillas et al. 2019; Sola et al. 2022, 2025). With a surface brightness limit of 30 mag arcsec−2 in the IE band, the Euclid ERO dataset represents a significant advance over previous wide-field surveys. For comparison, SDSS typically reaches ≃26 mag arcsec−2, DES achieves ≃27 mag arcsec−2, and the Subaru Hyper Suprime-Cam survey extends to 28 mag arcsec−2. The unprecedented depth of Euclid thus opens new avenues for the study of faint, extended LSB structures in galaxies, stellar halos, and the diffuse intergalactic medium. Figure 3 shows the images of the ETGs in the radial sample in the IE band, plotted as in Sola et al. (2022) to enhance the contrast. Our inspection reveals the lack of LSB structures. However, in the particular case of the ERO Perseus, the LSB detection might be hampered by two main issues: (i) the first is the observed crowding of elliptical galaxies towards the centre of the cluster, (ii) the second is the presence of the Galactic cirri emission, with a median surface brightness of 27.5 mag arcsec−2 (Cuillandre et al. 2025b), due to the low Galactic latitude of the Perseus cluster.
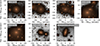 |
Fig. 3. Images of the ETGs in the radial sample in the IE band plotted with an asinh scale. |
4. Spectral energy distribution fitting
We constructed FUV-to-NIR SEDs, with the FUV, NUV, ugriz, IE, YE, JE, HE magnitudes. For the integrated sample of galaxies we used the FUV and NUV magnitudes from GALEX, while, for the radial sample, we constructed the SEDs as a function of the SMAs for each galaxy in Table 2, by using the FUV and NUV magnitudes from AstroSat/UVIT. To reconstruct the SFH of the target galaxies, we then fit the SEDs with the code CIGALE (Boquien et al. 2019), similarly to what was done in our previous work (Martocchia et al. 2025). More details on the adopted modules and fitting procedures are reported in Sect. 4.1. For the redshift, we used the average z = 0.0167 of the cluster, from Cuillandre et al. (2025b). For the six galaxies within the radial sample, the best-fit SEDs are shown in Fig. F.1.
4.1. Adopted CIGALE modules
Table E.1 reports on the adopted CIGALE modules and parameters used to fit the galaxies’ SEDs. We modelled the SFH with the sfhdelayed module, namely in the form SFR(t)∝t/τ2exp(−t/τ), where t is the SFH range and τ represents the e-folding timescale of SF.
Concerning the stellar models, we used the uvupturn module (Martocchia et al. 2025) to take into account the UV emission of evolved stars (the phenomenon of the UV upturn), based on the models by Maraston (2005). The models include a UV upturn in the form of an old, hot stellar component at certain defined temperatures, as in Maraston & Thomas (2000) and Le Cras et al. (2016), which simulates the evolution of post-main sequence (PMS) stars. This is not modelled using stellar tracks, thus the UV emission might come from hot horizontal branch stars as well as from post asymptotic giant branch, AGB-manqué, and other PMS evolutionary phases. We can then explore the main stellar parameters responsible for UV upturn stars regardless of their evolutionary path. We adopt a Salpeter (1955) IMF, the only IMF currently available for the upturn models. We note that the Salpeter IMF is bottom-heavier than Kroupa/Chabrier IMFs and is commonly associated with more massive ETGs (La Barbera et al. 2013; Tortora et al. 2013; Spiniello et al. 2014)12. However, in the figures below and throughout the paper, we report stellar masses calculated with a Chabrier IMF, in line with the results by Cuillandre et al. (2025b). We note indeed that there is only a difference in stellar mass by a factor of ≃0.25 dex downward with respect to a Salpeter IMF (Cimatti et al. 2008; Tortora et al. 2009, 2010). We refer to Martocchia et al. (2025) for more detail about the models and the CIGALE parameters. The UV emission in the used stellar models is degenerate with the emission produced by recent episodes of SF and young stars. To break this degeneracy, we used the CFHT Hα images in order to constrain the contribution of the young stellar population component. We measured the Hα emission of each galaxy and thus their star formation rate (SFR), and we used this as a constraint in the SED fitting. See Sect. 4.2 for more details. In Appendix G.1, we report on additional tests to constrain the possible contribution of a young stellar component to explain the UV emission of the target galaxies.
Regarding dust attenuation, we used the dustatt_modified_starburst module, based on the Calzetti et al. (2000) law. Additionally, we used the themis module to model dust emission, although our dataset only spans a wavelength range in the IR up to ≃1.7 μm, where dust emission is expected to be weak. We based our parameter space choice on the work by Nersesian et al. (2019) which investigated the properties of dust in more than 800 nearby galaxies. We report additional considerations and tests on the dust modelling in Sect. 4.3.
4.2. Ionised gas emission
The continuum-subtracted CFHT-Hα images of the target galaxies, as well as the FUV and NUV images, show a lack of structured regions such as clumps or knots, which demonstrates the absence of star forming complexes in both the integrated and radial samples. Additionally, for the radial sample, we checked the available optical spectra (see Sect. 2.4) to identify the presence of emission lines within the galaxies’ nuclei. We did not find any emission line in any selected galaxy. Hence, as was done in Martocchia et al. (2025), we used the continuum-subtracted CFHT-Hα images to measure an upper limit on the SFR in each galaxy from their Hα emission. We estimated the surface brightness limit in Hα by taking the standard deviation of the flux of 1000 regions (with the same shape as the original region), each one generated with a random position in the field of view. We then converted the Hα flux at 5σ into SFRs (Kennicutt 1998, Eq. (2)) and we included this rest-frame property in the SED fitting procedure through CIGALE as upper limit.
4.3. Dust modelling and AGN contamination
In order to understand how to treat the dust absorption and emission in the fit, we inspected the IE images and looked for filamentary structures in absorption, for galaxies in the radial and integrated sample. None is observed. The only visible dust structure is found in a disc-shape in the inner 0.5 kpc2 close to the centre of NGC 1270, 1277, 1278, and 1281. To get an estimation of the stellar extinction, we constructed a 2D model of the stellar distribution for each galaxy in the sample, on the IE images through the same isophote analysis presented in Sect. 3.3. We then subtracted the stellar 2D model from the original image and we estimated the extinction coefficient in the IE band, AIE (as in Kulkarni et al. 2014; Boselli et al. 2022; Martocchia et al. 2025). The subtraction of the 2D model does not find any significant disc for NGC 1270, for which the dust disc is very weak and also barely visible in the IE image. The visible dust discs and extinction maps are reported in Fig. 4 for NGC 1277 (left), NGC 1278 (centre) and NGC 1281 (right). The extinction in the IE band, AIE reaches maximum values of 0.4 mag. We transformed the extinction map from AIE to AV by using the extinction coefficients calculated as in Sect. 3.1, and by assuming a RV = 3.1. Then, we transformed AV in Σdust by using
 (2)
(2)
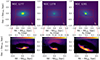 |
Fig. 4. Top panels: IE images zoomed in the inner regions of NGC 1277, NGC 1278, and NGC 1281, from left to right. Bottom panels: Extinction maps in the IE filter, AIE, constructed from the top panels. North is up and east is to the left. |
where Qext is the extinction coefficient factor, ρ is the dust mass density, and a is the grain radius (e.g. Kitayama et al. 2009). We adopted the standard values given in the equation and we integrated over the disc of dust where AV > 0. Assuming that the dust is uniformly distributed over the disc, from the extinction maps we obtain dust masses within the range log10(Mdust, ext/M⊙)∈[5.6, 5.9].
We compared these dust masses with those obtained by fitting the integrated SEDs of the targeted galaxies from the FUV to the IR with CIGALE, by including images from Spitzer/IRAC and WISE (Sect. 2.4). From a first inspection of the IR images, we note that there is no visible signal in the WISE W4 band at 22 μm, in any galaxy, thus likely indicating a weak dust emission from these galaxies. We extracted the flux in the different bands as in Sect. 3.3 by using an elliptical region with the SMA equal to their Reff in the IE band (Table 2, Cuillandre et al. 2025b), and the position angle and ellipticity coming from the isophote fit. For the SED fit, we used the same modules and parameters as listed in Table E.1. Fluxes with a S/N < 3 are considered as upper limits and this is the case for all galaxies in the W4 WISE band. The SED fit yields dust masses in the range log10(Mdust, SED/M⊙)∈[5.6, 7.5], hence overall consistent or higher than those estimated from the inner disc extinction map. Nevertheless, the dust masses from the SEDs are not well constrained in the fit, i.e. we obtain that the 1σ error is larger than the mass value. This might be due to both the lack of FIR data for these galaxies, needed to better constrain the dust emission peak around 100 μm, or an intrinsically weak concentration of dust. We assume here that the emission of dust in all the analysed ETGs is weak. As an additional test, we performed the SED fitting a second time, without including the themis module. We found that the results of the paper stay unchanged.
As is explained in Sect. 3.3, we masked the central regions of NGC 1270, 1271, 1272, 1277, 1278, and 1281, for the CIGALE SED fitting (both integrated and radial), due to the presence of AGNs in their centres. We did not mask the central regions for the remaining galaxies in the sample. However, as an additional test, we performed the same SED fitting analysis without masking the central regions of NGC 1270, 1271, 1272, 1277, 1278, and 1281, and we find that the results of the paper stay unchanged (see Appendix G.2).
5. Results
5.1. Gradients of stellar properties
Figure 5 shows the result of the radial SED fitting. We estimated the properties of the targeted galaxies within the radial sample as a function of their projected SMA, namely the mass-weighted ages, stellar metallicities, temperatures of the UV upturn, and SF timescales. As expected (see Appendix D), the SPs of the galaxies in our sample are old, with mass-weighted ages ≳ 10 Gyr at all sampled SMAs. Overall, they appear to be more metal-rich (twice solar) in their centre with respect to their outskirts. There are exceptions for NGC 1278 and NGC 1281, where the obtained stellar metallicities are flat and half-solar, although for these two galaxies the SMA coverage is rather small. All galaxies need the presence of the UV upturn to explain their FUV emission, with mean temperatures ⟨TUV, rad⟩ = 26 100 ± 3000 K. Finally, the SFH of these galaxies proceeded with an e-folding SF timescale that is τ ∈ [100, 1500] Myr, with an average ⟨τrad⟩ = 770 ± 280 Myr. For the extended galaxies NGC 1272 and NGC 1278 (Reff > 5 kpc), we note that τ is on average smaller in the central regions with respect to their outskirts, corresponding to SMA/Reff ≳ 0.2 and ≳0.4, respectively. This might likely indicate that the centres of such massive ETGs enriched faster than its peripheries. To assess the reliability of the stellar parameters derived from the SED fitting, we refer to the mock analysis performed in Martocchia et al. (2025, their Sect. 5.5 and Appendix E), as we used the same method here. In brief, a catalogue of simulated galaxies is generated, where the model fluxes are re-sampled adding gaussian noise. The mock galaxies are then analysed in the same fashion as the real galaxies. All parameters are well recovered, showing strong correlations among the injected input and the recovered output (Martocchia et al. 2025, their Fig. E.1).
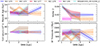 |
Fig. 5. SED fitting results of galaxy properties for the radial sample of Perseus ETGs. From the upper left to the lower right we show the mass-weighted age, stellar metallicity, temperature of the UV upturn, and SF timescale as a function of the SMA/Reff. Shaded areas represent 1σ errors. |
Next, we calculated age and metallicity gradients, as they are very useful measurements to discriminate among different formation and evolution scenarios of ETGs (we refer to Sect. 6 for more discussion and references). We computed logarithmic gradients for the quantity X as Δlog10(X)/Δlog10(R/Reff) between R1/Reff = 0.1 and R2/Reff ∈ [0.3, 1.6], depending on the galaxy, to be able to compare them with Virgo galaxies by Martocchia et al. (2025). Figure 6 shows the mass-weighted age and metallicity gradients as a function of stellar mass for both clusters. We find that gradients in age are typically shallow [∇(Age) ≳ − 0.2 dex], comparable between the two clusters. Overall, gradients in Z for Virgo are quite shallow, while for Perseus only 2 out of 6 galaxies have shallow gradients. We indeed find a steep ∇Z for the extended galaxy NGC 1272, but we note that we are calculating an inner gradient, between 0.1 and 0.3 R/Reff. Additionally, we note that within our samples we only have massive ETGs [log10(M*/M⊙)≳10]. Shallower gradients for more massive ETGs are found in a few studies (e.g., Tortora et al. 2010; Zibetti et al. 2020; Liao & Cooper 2023), however our sample is too small to make a meaningful comparison. Additionally, we note here that we are calculating gradients for compact galaxies in Perseus, such as NGC 1270, NGC 1277 and WISEAJ031922_30+412545_6, for which the metallicity gradients are quite steep, i.e. ∇Z ≲ −0.4 dex. This is consistent with the spectroscopic works by Trujillo et al. (2014), Ferré-Mateu et al. (2017), and Yıldırım et al. (2017). A further discussion of stellar gradients is provided in Sects. 6.1 and 6.2.
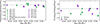 |
Fig. 6. Mass-weighted age gradients (left) and metallicity gradients (right) as a function of galaxy stellar mass, calculated between R1/Reff = 0.1 and R2/Reff ∈ [0.3, 1.6]. Purple (green) symbols are Virgo (Perseus) galaxies. The horizontal dashed grey line indicates a flat gradient. We note that the gradient of NGC 1272 is an inner gradient, calculated up to 0.3 Reff. See text for more details. |
5.2. The integrated sample
Figure 7 shows the TUV (left panel) and τ (right panel), colour-coded by the mass-weighted ages of the integrated sample. Overall, ETGs need the presence of the UV upturn to explain their FUV emission, with mean temperatures ⟨TUV, int⟩ = 33 800 ± 8500 K. Interestingly, the average value is consistent within 1σ with the radial sample, though slightly higher. Comparing integrated and radial TUV for the six galaxies in common, the integrated values are generally higher, but agree within uncertainties in four cases. This difference may arise because the radial analysis probes subregions, whereas the integrated study reflects the total galaxy flux. Given the small sample and overall consistency, no firm conclusions can be drawn, and a larger sample is needed to assess whether this trend is general or restricted to a few cases. We also note that higher mass ETGs tend to have lower TUV, but errors are too large to draw strong conclusions. SF timescales for the integrated sample are τ ∈ [250, 1000] Myr, except for three low-mass galaxies for which τ reaches ≃1750 Myr. The average is ⟨τint⟩ = 656 ± 380 Myr. Hence, these results imply that the massive ETGs in Perseus must have assembled their masses relatively fast. We estimated the fraction of stellar mass that each galaxy in the sample grows at redshift z ≃ 5, based on the integration of the SFHs that we obtained. Then, we multiplied the stellar mass at z = 0 from Cuillandre et al. (2025b) by the mass fractions to obtain the stellar mass at z ≃ 5. Errors at 1σ on the mass fraction are estimated through the 1σ errors on the stellar masses from CIGALE. Errors at 1σ on the stellar masses at z ≃ 5 are calculated by propagating the stellar mass error from Cuillandre et al. (2025b) and the error on the fractions. We report the results in Fig. 8, where we show the M* at z = 0 (from Cuillandre et al. 2025b) versus the estimated M* at z ≃ 5 for the Perseus integrated sample, colour-coded by the assembled fraction of stellar mass before z ≃ 5. We observe some discrepancy between integrated and radial analysis, with the majority of the cases where the stellar mass at z ≃ 5 is higher for the integrated study with respect to the radial one. This is likely due to the difference in the aperture radii used in the two studies. Recent works compare resolved and integrated SED fitting techniques and find that the difference in the derived stellar mass is negligible (Euclid Collaboration: Abdurro’uf et al. 2025). We compare our results with the stellar masses estimated by JWST for red quiescent galaxies at z ≃ 5 from the compilation by Antwi-Danso et al. (2025), more specifically from the works by Carnall et al. (2024), de Graaff et al. (2025), and Barrufet et al. (2025). We note that the majority of galaxies has assembled more than 30–50% at z ≃ 5. Around ≃20 galaxies show an extreme accretion close to ≃100%. Finally, we note that the grown stellar mass in both Perseus and Virgo clusters’ ETGs is comparable to that of JWST red quiescent galaxies for the most massive ETGs in the sample, around a mass log10(M*/M⊙)≳10.8.
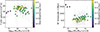 |
Fig. 7. Temperature of the UV upturn (left), and SF timescale, τ (right), as a function of stellar mass (from Cuillandre et al. 2025b) for the integrated sample, colour-coded by the mass-weighted ages. |
6. Discussion
6.1. Stellar gradients and the role of mergers
According to the two-phase scenario originally proposed by Oser et al. (2010), stars form rapidly in situ, at z ≳ 2, producing a compact galaxy characterised by a steep metallicity gradient (∇Z < −0.35 dex; e.g. Larson 1974; Carlberg 1984; Thomas et al. 1999; Kobayashi 2004; Pipino et al. 2010) and a positive age gradient. The latter arises because the galaxy’s deep potential well traps stellar winds, allowing ongoing central SF and resulting in younger SPs toward the core. Nevertheless, mechanisms such as AGN feedback or morphological quenching (Martig et al. 2009) can suppress central SF, thus flattening the inner radial profiles (e.g. Zibetti et al. 2020). In the second phase, ETGs increase their stellar mass through dissipationless mergers, which modify the pre-existing gradients in different ways. Major mergers generally tend to flatten all gradients, as metal-rich stars from the core are redistributed into the outer regions (∇Z ≃ −0.1 dex; e.g. Ogando et al. 2005; Di Matteo et al. 2009; Kobayashi 2004). Conversely, minor mergers tend to steepen metallicity gradients, since the accreted satellites are typically more metal-poor than the central regions of the host galaxy (e.g. Hirschmann et al. 2015).
In the literature, it is possible to find a plethora of studies that aimed at constraining the formation of ETGs through the calculation of gradients from both imaging and spectroscopic surveys. Informative summaries are found in Goddard et al. (2017) and in Zibetti et al. (2020), and references therein. We find that the age and metallicity gradients of the galaxies within the sample are overall shallow [∇(Age/Z)≳ − 0.2 dex], except for the compact galaxies, which we discuss in Sect. 6.2. However, there are several spectroscopic studies that find steeper Z gradients for ETGs (e.g. Martín-Navarro et al. 2018; Parikh et al. 2019; Zibetti et al. 2020, and references therein), with Martín-Navarro et al. (2018) finding that the more massive galaxies show steeper Z gradients with respect to lower mass ones, possibly in contrast with our results. On the contrary, other works find that more massive galaxies show shallower stellar gradients (Tortora et al. 2010; Zibetti et al. 2020; Liao & Cooper 2023). First of all, the cited works are based on much larger samples of ETGs spanning different environments. We note that in this work we analyse ETGs only residing in very dense environments, i.e. galaxy clusters, where gradients have also been found to be shallower (La Barbera et al. 2005), and have likely been flattened by the higher frequency of major mergers in such harsh environments. As the reported sample of stellar gradients is neither complete nor statistically significant, it would be insightful to enlarge this dataset and compare large samples both in cluster and field environments.
Additionally, we checked for information on the GC systems of these galaxies. The colour distribution of GCs have indeed been interpreted as the imprint of the two-phase formation scenario of ETGs. The red GCs are more metal-rich and more centrally concentrated: they represent the in situ SF episode(s); blue or metal-poor GCs, which extend further in the outskirts of galaxies, are thought to be accreted from mergers with smaller satellites (e.g. Côté et al. 1998). While NGC 1277 is found to only host a single, red GC population (Beasley et al. 2018), all the other galaxies13 in the sample show both a red and blue GC population (Alamo-Martínez et al. 2021; Harris 2023). This demonstrates that all galaxies underwent a rapid phase of in situ SF. Then, the observed shallow gradients might suggest either that major mergers have flattened the gradients during the secular evolution after the in situ collapse, or AGN feedback had played a role in flattening the gradients (Tortora et al. 2009, 2010).
6.2. Relic galaxies: A comparison with recent works
The compact galaxies in our sample (NGC 1270, NGC 1277, NGC 1281, and WISEAJ031922_39+412545_6) are usually considered to be good candidate relic galaxies (van Dokkum et al. 2010)14. Overall, we find that compact galaxies have steeper metallicity gradients compared to more extended ETGs, although this needs to be confirmed with a more significant sample. Because their steep gradients persist to large radii (up to SMA/Reff ≃ 1.6), these galaxies likely avoided both minor and major mergers, which would otherwise have disrupted their structure and flattened their gradients. For NGC 1277, we find ∇Z = −0.60 ± 0.23 dex, old SPs and a slightly positive age gradient [∇(Age) = 0.09 ± 0.07 dex], a very fast SFH (τ < 1000 Myr), and an assembled mass fraction at z ≃ 5 close to 100%. This is consistent with the works by Trujillo et al. (2014) and Ferré-Mateu et al. (2017), which measure a ∇Z ≃ −0.54 dex and ∇(Age) ≃ 0.02 dex. For NGC 1270, we also find a steep gradient ∇Z = −0.40 ± 0.12 dex, which is consistent with what was obtained by Yıldırım et al. (2017), their Fig. 11. We find instead a slightly subsolar metallicity for NGC 1281, contrary to what is found by Yıldırım et al. (2016, 2017) who found solar metallicity within the centre of this galaxy (see Appendix D), as well as steeper gradients. The difference with their work might be due to the small coverage in projected radius available for this work. Also, the discrepancy could be due to the fact that in our models we do not include chemical abundance ratios typical of ETGs, foreseen as a next step in order to improve the upturn SP models. We also observe a very steep gradient for the compact galaxy WISEAJ031922_39+412545_6, together with old SPs and large assembled fractions at z ≃ 5. Hence, WISEAJ031922_39+412545_6 might be considered a good candidate relic galaxy. Similarly, many other galaxies within the Perseus cluster might show a high degree of relicness (Ferré-Mateu et al. 2017). As defined in Spiniello et al. (2024), these are ETGs that assembled more than 75% of their stellar masses by z = 2. However, these considerations need to be confirmed through more in-depth structural and kinematical analysis.
6.3. Comparison with high-z red quiescent galaxies from JWST
Within our sample, we are looking for ETGs in the local Universe that might represent the descendants of the most massive red and quiescent galaxies observed by JWST at z > 4.6. It is important to consider that local ETGs have larger sizes than red galaxies observed at high redshfits (e.g. Daddi et al. 2005), therefore a one-to-one comparison could only be performed with the relic galaxies. However, determining the number of nearby ETGs with formation histories analogous to massive high-z red, quiescent galaxies is crucial, as their resolved SPs and SFHs might provide key constraints on cosmological and galaxy formation models. The reconstructed SFHs of the ETGs in this work show that the most massive galaxies in the sample [with log10(M*/M⊙) > 10.8] might have had comparable stellar masses, at z ≃ 5, than the observed massive red quiescent galaxies observed by JWST at similar redshifts (Fig. 8). We find 19 ETGs within the sample (including Virgo galaxies) that had log10(M*/M⊙) > 10.6 at z ≃ 5, comparable to the galaxies by Carnall et al. (2023, 2024). Additionally, we find that only 5 local ETGs had extreme stellar masses log10(M*/M⊙) > 11 at z ≃ 5 comparable to the most extreme case found by JWST (de Graaff et al. 2025). We suggest then that we could look for the progeny of the quiescent JWST high-mass galaxies among the most massive ETGs, which is consistent with what was already predicted by Thomas et al. (2005).
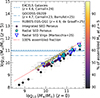 |
Fig. 8. Stellar mass at z = 0 as a function of the estimated stellar mass at z ≃ 5. Data are colour-coded by the fraction of assembled stellar mass by z ≃ 5. The Perseus integrated sample is connected by vertical dashed blue lines to the results of the radial analysis (cyan stars). Open upside-down blue triangles indicate the radial results on Virgo massive ETGs by Martocchia et al. (2025). The dotted red line represents assembled fractions of 100%, while the solid, dashed, and dash-dotted blue lines indicate the stellar masses found for red quiescent galaxies with JWST at z > 4.6 by Carnall et al. (2023, 2024), de Graaff et al. (2025), and Barrufet et al. (2025). Compilation from Antwi-Danso et al. (2025). |
7. Summary and conclusions
We combined the exceptional image quality and depth of the ERO Perseus with FUV and NUV observations from GALEX and AstroSat/UVIT, as well as with ugrizHα data from MegaCam at the CFHT, to deliver FUV-to-NIR magnitudes of the 87 brightest galaxies within the Perseus cluster (Table B.1). We compared the integrated colours of Perseus in FUV − NUV and FUV − IE with those of the Virgo cluster galaxies in Fig. 1, showing that Perseus and Virgo ETGs have similar stellar mass-colour diagrams. On the contrary, we observe different FUV − NUV and FUV − IE colours for the LTGs, with Perseus LTGs being much redder and less numerous (at similar stellar masses) than Virgo’s LTGs. This suggests an efficient ongoing quenching process due to RPS (Boselli et al. 2014).
We reconstructed the SFH of the ETGs in the sample through the SED fitting code CIGALE. For a sub-sample of the galaxies with stellar masses of log10(M*/M⊙) > 10.3, we analysed their radial stellar properties. We combined a high-angular-resolution, high-sensitivity multi-wavelength dataset (FUV-to-NIR) with state-of-the-art SP models, which include a flexible UV-upturn modelling as a function of fuel and temperature (Maraston & Thomas 2000; Le Cras et al. 2016; Martocchia et al. 2025). We studied radial profiles that span from the galaxy nuclei (SMA/Reff ≃ 0.1) up to 1.5 Reff for the majority of these ETGs. We showed that, despite the lack of ongoing SF, the ETGs in the sample have non-negligible UV emission (Fig. 2) that is comparable to that of the most massive ETGs in Virgo. This is most likely due to old, low-mass stars in late evolutionary stages, i.e. the UV upturn. For the majority of ETGs within the sample, we found that the SEDs of Perseus ETGs are indeed well described by a UV upturn component. This might suggest that the UV upturn is an intrinsic property of ETGs, as was proposed by Boissier et al. (2018). The average temperatures we find for the radial sample are ⟨TUV, rad⟩ = 26 100 ± 3000 K: slightly lower, albeit comparable, with what we find for Virgo ETGs in Martocchia et al. (2025). For the integrated sample we find ⟨TUV, int⟩ = 33 800 ± 8500 K. We also find that the SF timescales derived for all ETGs are relatively small. For the radial sample, we estimate timescales of τ ∈ [100, 1500] Myr, while for the full sample τ ∈ [250, 1700] Myr. Additionally, we find shallow age and metallicity gradients, except for the compact galaxies within the sample. We speculate that the shallow gradients could be driven by AGN feedback or major mergers, while a steep behavior in metallicity is consistent with the inside-out growth scenario, where the densest central regions collapse and form stars on very short timescales (e.g. Pipino et al. 2010). For the compact galaxies, we then find results that are consistent with the view that such galaxies might be the direct descendants (relics) of the red compact galaxies found at high-z, remaining untouched by mergers. Through the retrieved SFH with CIGALE, we estimated the fraction of formed stellar mass at z ≃ 5 for all the ETGs in the sample (see Fig. 8). We show that for present-day stellar masses of log10(M*/M⊙)≳10.8, these galaxies had masses at z ≃ 5 comparable to those reported by recent JWST studies of red quiescent galaxies at similar redshifts (Antwi-Danso et al. 2025, and references therein). Our results, together with those regarding the most massive ETGs in Virgo, might suggest that massive local ETGs inhabiting massive clusters [total mass log10(M/M⊙)≳1014 M⊙] enriched fast and in a similar way to massive red galaxies at high redshift, likely representing their progeny.
Nevertheless, the reported works for Virgo and Perseus, which are representative of massive local clusters, serve as benchmark projects that will pave the way for similar studies of a much larger sample of ETGs in diverse environments, from the richest galaxy clusters down to cluster groups, filaments, and voids. This study will be complementary to several other techniques already being studied by the Euclid community, such as in Euclid Collaboration: Kovačić et al. (2025), Euclid Collaboration: Abdurro’uf et al. (2025), and Euclid Collaboration: Nersesian et al. (2026) to estimate the physical properties of galaxies mapped with an unprecedented sky coverage (14 000 deg2), angular resolution, and image quality in terms of the sensitivity that Euclid will soon provide. This will also enable SP analyses in combination with the detection of LSB features down to 30 mag arcsec−2, as well as their GC population (e.g. Saifollahi et al. 2025; Larsen et al. 2025), to reconstruct the assembly histories of a wide sample of ETGs. These datasets will be coupled with other upcoming surveys such as Rubin/LSST, as well as FUV and NUV observations: the GALEX All-sky Imaging Survey offers a large sky coverage of more than ≃22 000 deg2 (Bianchi et al. 2017), with a limiting magnitude of 21–22; the GALEX Medium-depth Imaging Survey is also available, reaching deeper limiting magnitudes of ≃23 (Bianchi et al. 2014). In addition, observations in the FUV with AstroSat are ongoing, with more than 1700 targets observed so far (Bordoloi et al. 2024). With AstroSat/UVIT we have already obtained approved programmes of several kiloseconds to expand the Perseus UV footprint (PI S. Martocchia) as well as for the Fornax ERO field (PI T. Woods). The detection of FUV emission in ETGs, coupled with the lack of gas emission, and consequently of residual SF, highlights the ubiquity of UV upturn stars, whose origin remains a subject of debate. This demonstrates the need for future sensitive FUV observatories, such as the Cosmological Advanced Survey Telescope for Optical and Ultraviolet Research (CASTOR; Côté et al. 2025), the UltraViolet EXplorer (UVEX; Kulkarni et al. 2021; Fucik 2024), and NASA’s upcoming flagship mission, the Habitable Worlds Observatory, which will be key for studies of SPs in galaxies, including the origin of UV upturn stars (Smercina et al. 2025). In parallel, next-generation FIR facilities with a high angular resolution, such as the proposed PRobe far-Infrared Mission for Astronomy (PRIMA; Ciesla et al. 2025), will also be needed, to spatially resolve dust emission in galaxies and extend the wavelength coverage of such high-resolution studies to the FIR.
Data availability
Tables B.1, B.2, and B.3 are available at the CDS via https://cdsarc.cds.unistra.fr/viz-bin/cat/J/A+A/708/A63
Acknowledgments
We thank the anonymous referee for a constructive report. We also thank C. Carvajal-Bohorquez and O. Ilbert for useful discussions. M.Boquien acknowledges support from the ANID BASAL project FB210003. This work was supported by the French government through the France 2030 investment plan managed by the National Research Agency (ANR), as part of the Initiative of Excellence of Université Côte d’Azur under reference number ANR-15-IDEX-01. This work has made use of the Early Release Observations (ERO) data from the Euclid/mission of the European Space Agency (ESA), 2024, https://doi.org/10.57780/esa-qmocze3. The Euclid Consortium acknowledges the European Space Agency and a number of agencies and institutes that have supported the development of Euclid, in particular the Agenzia Spaziale Italiana, the Austrian Forschungsförderungsgesellschaft funded through BMIMI, the Belgian Science Policy, the Canadian Euclid Consortium, the Deutsches Zentrum für Luft- und Raumfahrt, the DTU Space and the Niels Bohr Institute in Denmark, the French Centre National d’Etudes Spatiales, the Fundação para a Ciência e a Tecnologia, the Hungarian Academy of Sciences, the Ministerio de Ciencia, Innovación y Universidades, the National Aeronautics and Space Administration, the National Astronomical Observatory of Japan, the Netherlandse Onderzoekschool Voor Astronomie, the Norwegian Space Agency, the Research Council of Finland, the Romanian Space Agency, the State Secretariat for Education, Research, and Innovation (SERI) at the Swiss Space Office (SSO), and the United Kingdom Space Agency. A complete and detailed list is available on the Euclid web site (www.euclid-ec.org).
References
- Agrawal, P. C. 2006, Adv. Space Res., 38, 2989 [Google Scholar]
- Alamo-Martínez, K. A., Chies-Santos, A. L., Beasley, M. A., et al. 2021, MNRAS, 503, 2406 [CrossRef] [Google Scholar]
- Antwi-Danso, J., Papovich, C., Esdaile, J., et al. 2025, ApJ, 978, 90 [Google Scholar]
- Baggen, J. F. W., van Dokkum, P., Labbé, I., et al. 2023, ApJ, 955, L12 [NASA ADS] [CrossRef] [Google Scholar]
- Baker, W. M., Lim, S., D’Eugenio, F., et al. 2025a, MNRAS, 539, 557 [Google Scholar]
- Baker, W. M., Valentino, F., Lagos, C. d. P., et al. 2025b, A&A, 702, A270 [NASA ADS] [CrossRef] [EDP Sciences] [Google Scholar]
- Barrufet, L., Oesch, P. A., Marques-Chaves, R., et al. 2025, MNRAS, 537, 3453 [Google Scholar]
- Beasley, M. A., Trujillo, I., Leaman, R., & Montes, M. 2018, Nature, 555, 483 [NASA ADS] [CrossRef] [Google Scholar]
- Bianchi, L., Conti, A., & Shiao, B. 2014, Adv. Space Res., 53, 900 [Google Scholar]
- Bianchi, L., Shiao, B., & Thilker, D. 2017, ApJS, 230, 24 [Google Scholar]
- Boissier, S., Cucciati, O., Boselli, A., Mei, S., & Ferrarese, L. 2018, A&A, 611, A42 [NASA ADS] [CrossRef] [EDP Sciences] [Google Scholar]
- Boquien, M., Burgarella, D., Roehlly, Y., et al. 2019, A&A, 622, A103 [NASA ADS] [CrossRef] [EDP Sciences] [Google Scholar]
- Bordoloi, S., Shalima, P., Gogoi, R., & Murthy, J. 2024, PASA, 41, e086 [Google Scholar]
- Boselli, A., & Gavazzi, G. 2006, PASP, 118, 517 [Google Scholar]
- Boselli, A., & Gavazzi, G. 2009, A&A, 508, 201 [NASA ADS] [CrossRef] [EDP Sciences] [Google Scholar]
- Boselli, A., Voyer, E., Boissier, S., et al. 2014, A&A, 570, A69 [NASA ADS] [CrossRef] [EDP Sciences] [Google Scholar]
- Boselli, A., Fossati, M., Ferrarese, L., et al. 2018, A&A, 614, A56 [NASA ADS] [CrossRef] [EDP Sciences] [Google Scholar]
- Boselli, A., Fossati, M., Longobardi, A., et al. 2019, A&A, 623, A52 [NASA ADS] [CrossRef] [EDP Sciences] [Google Scholar]
- Boselli, A., Fossati, M., Longobardi, A., et al. 2022, A&A, 659, A46 [NASA ADS] [CrossRef] [EDP Sciences] [Google Scholar]
- Boyett, K., Trenti, M., Leethochawalit, N., et al. 2024, Nat. Astron., 8, 657 [CrossRef] [Google Scholar]
- Boylan-Kolchin, M. 2023, Nat. Astron., 7, 731 [NASA ADS] [CrossRef] [Google Scholar]
- Bradley, L., Sipőcz, B., Robitaille, T., et al. 2023, https://doi.org/10.5281/zenodo.7946442 [Google Scholar]
- Bruzual, G., & Charlot, S. 2003, MNRAS, 344, 1000 [NASA ADS] [CrossRef] [Google Scholar]
- Buitrago, F., Trujillo, I., Conselice, C. J., et al. 2008, ApJ, 687, L61 [Google Scholar]
- Burgarella, D., Buat, V., & Iglesias-Páramo, J. 2005, MNRAS, 360, 1413 [NASA ADS] [CrossRef] [Google Scholar]
- Calzetti, D., Armus, L., Bohlin, R. C., et al. 2000, ApJ, 533, 682 [NASA ADS] [CrossRef] [Google Scholar]
- Canning, R. E. A., Ryon, J. E., Gallagher, J. S., et al. 2014, MNRAS, 444, 336 [CrossRef] [Google Scholar]
- Cantiello, M., Blakeslee, J. P., Ferrarese, L., et al. 2024, ApJ, 966, 145 [NASA ADS] [CrossRef] [Google Scholar]
- Carlberg, R. G. 1984, ApJ, 286, 403 [NASA ADS] [CrossRef] [Google Scholar]
- Carnall, A. C., McLure, R. J., Dunlop, J. S., et al. 2023, Nature, 619, 716 [NASA ADS] [CrossRef] [Google Scholar]
- Carnall, A. C., Cullen, F., McLure, R. J., et al. 2024, MNRAS, 534, 325 [NASA ADS] [CrossRef] [Google Scholar]
- Casey, C. M., Akins, H. B., Shuntov, M., et al. 2024, ApJ, 965, 98 [NASA ADS] [CrossRef] [Google Scholar]
- Chabrier, G. 2003, ApJ, 586, L133 [NASA ADS] [CrossRef] [Google Scholar]
- Ciesla, L., Dowell, C. D., Sauvage, M., et al. 2025, J. Astron. Telesc. Instrum. Syst., 11, 031625 [Google Scholar]
- Cimatti, A., Cassata, P., Pozzetti, L., et al. 2008, A&A, 482, 21 [NASA ADS] [CrossRef] [EDP Sciences] [Google Scholar]
- Code, A. D., & Welch, G. A. 1979, ApJ, 228, 95 [Google Scholar]
- Comerón, S., Trujillo, I., Cappellari, M., et al. 2023, A&A, 675, A143 [NASA ADS] [CrossRef] [EDP Sciences] [Google Scholar]
- Conselice, C. J., Gallagher, J. S., III, & Wyse, R. F. G. 2001, AJ, 122, 2281 [NASA ADS] [CrossRef] [Google Scholar]
- Cortese, L., Boissier, S., Boselli, A., et al. 2012, A&A, 544, A101 [NASA ADS] [CrossRef] [EDP Sciences] [Google Scholar]
- Côté, P., Marzke, R. O., & West, M. J. 1998, ApJ, 501, 554 [Google Scholar]
- Côté, P., Woods, T., Hutchings, J. B., et al. 2025, J. Astron. Telesc. Instrum. Syst., 11, 042202 [Google Scholar]
- Cuillandre, J.-C., Bertin, E., Bolzonella, M., et al. 2025a, A&A, 697, A6 [Google Scholar]
- Cuillandre, J.-C., Bolzonella, M., Boselli, A., et al. 2025b, A&A, 697, A11 [Google Scholar]
- Daddi, E., Renzini, A., Pirzkal, N., et al. 2005, ApJ, 626, 680 [NASA ADS] [CrossRef] [Google Scholar]
- de Graaff, A., Setton, D. J., Brammer, G., et al. 2025, Nat. Astron., 9, 280 [Google Scholar]
- De Lucia, G., Fontanot, F., Xie, L., & Hirschmann, M. 2024, A&A, 687, A68 [NASA ADS] [CrossRef] [EDP Sciences] [Google Scholar]
- Di Matteo, P., Pipino, A., Lehnert, M. D., Combes, F., & Semelin, B. 2009, A&A, 499, 427 [NASA ADS] [CrossRef] [EDP Sciences] [Google Scholar]
- Donas, J., Deharveng, J.-M., Rich, R. M., et al. 2007, ApJS, 173, 597 [NASA ADS] [CrossRef] [Google Scholar]
- Dressler, A. 1980, ApJ, 236, 351 [Google Scholar]
- Duc, P.-A., Cuillandre, J.-C., Karabal, E., et al. 2015, MNRAS, 446, 120 [Google Scholar]
- Emsellem, E. 2013, MNRAS, 433, 1862 [NASA ADS] [CrossRef] [Google Scholar]
- Emsellem, E., Cappellari, M., Krajnović, D., et al. 2011, MNRAS, 414, 888 [Google Scholar]
- Euclid Collaboration (Abdurro’uf, et al.) 2025, A&A, 702, A72 [Google Scholar]
- Euclid Collaboration (Cropper, M., et al.) 2025, A&A, 697, A2 [Google Scholar]
- Euclid Collaboration (Jahnke, K., et al.) 2025, A&A, 697, A3 [Google Scholar]
- Euclid Collaboration (Kovačić, I., et al.) 2025, A&A, 695, A284 [Google Scholar]
- Euclid Collaboration (Mellier, Y., et al.) 2025, A&A, 697, A1 [Google Scholar]
- Euclid Collaboration (Nersesian, A., et al.) 2026, A&A, 707, A231 [Google Scholar]
- Euclid Collaboration (Scaramella, R., et al.) 2022, A&A, 662, A112 [NASA ADS] [CrossRef] [EDP Sciences] [Google Scholar]
- Euclid Collaboration (Schirmer, M., et al.) 2022, A&A, 662, A92 [NASA ADS] [CrossRef] [EDP Sciences] [Google Scholar]
- Euclid Early Release Observations. 2024, A&A, in press, https://doi.org/10.57780/esa-qmocze3 [Google Scholar]
- Falco, E. E., Kurtz, M. J., Geller, M. J., et al. 1999, PASP, 111, 438 [Google Scholar]
- Ferré-Mateu, A., Mezcua, M., Trujillo, I., Balcells, M., & van den Bosch, R. C. E. 2015, ApJ, 808, 79 [CrossRef] [Google Scholar]
- Ferré-Mateu, A., Trujillo, I., Martín-Navarro, I., et al. 2017, MNRAS, 467, 1929 [NASA ADS] [Google Scholar]
- Fucik, J. 2024, SPIE Conf. Ser., 13093, 130933I [Google Scholar]
- Gadotti, D. A., & de Sá-Freitas, C. 2025, MNRAS, 544, L58 [Google Scholar]
- Gendron-Marsolais, M. L., Hull, C. L. H., Perley, R., et al. 2021, ApJ, 911, 56 [NASA ADS] [CrossRef] [Google Scholar]
- George, K., Boselli, A., Cuillandre, J. C., et al. 2025, A&A, 701, A40 [NASA ADS] [CrossRef] [EDP Sciences] [Google Scholar]
- Glazebrook, K., Nanayakkara, T., Schreiber, C., et al. 2024, Nature, 628, 277 [NASA ADS] [CrossRef] [Google Scholar]
- Goddard, D., Thomas, D., Maraston, C., et al. 2017, MNRAS, 466, 4731 [NASA ADS] [Google Scholar]
- Gordon, K. D., Clayton, G. C., Decleir, M., et al. 2023, ApJ, 950, 86 [CrossRef] [Google Scholar]
- Greene, J. E., Murphy, J. D., Comerford, J. M., Gebhardt, K., & Adams, J. J. 2012, ApJ, 750, 32 [Google Scholar]
- Greene, J. E., Murphy, J. D., Graves, G. J., et al. 2013, ApJ, 776, 64 [Google Scholar]
- Harris, W. E. 2023, ApJS, 265, 9 [CrossRef] [Google Scholar]
- Hirschmann, M., Naab, T., Ostriker, J. P., et al. 2015, MNRAS, 449, 528 [CrossRef] [Google Scholar]
- Ibata, R. A., McConnachie, A., Cuillandre, J.-C., et al. 2017, ApJ, 848, 128 [Google Scholar]
- Jedrzejewski, R. I. 1987, MNRAS, 226, 747 [Google Scholar]
- Kang, W., Hwang, H. S., Song, H., et al. 2024, ApJS, 272, 22 [Google Scholar]
- Kennicutt, R. C., Jr. 1998, ARA&A, 36, 189 [Google Scholar]
- Kimmig, L. C., Remus, R.-S., Seidel, B., et al. 2025, ApJ, 979, 15 [Google Scholar]
- Kitayama, T., Ito, Y., Okada, Y., et al. 2009, ApJ, 695, 1191 [NASA ADS] [CrossRef] [Google Scholar]
- Kluge, M., Hatch, N., Montes, M., et al. 2025, A&A, 697, A13 [NASA ADS] [CrossRef] [EDP Sciences] [Google Scholar]
- Kobayashi, C. 2004, MNRAS, 347, 740 [NASA ADS] [CrossRef] [Google Scholar]
- Kulkarni, S., Sahu, D. K., Chaware, L., Chakradhari, N. K., & Pandey, S. K. 2014, New Astron., 30, 51 [NASA ADS] [CrossRef] [Google Scholar]
- Kulkarni, S. R., Harrison, F. A., Grefenstette, B. W., et al. 2021, arXiv e-prints [arXiv:2111.15608] [Google Scholar]
- La Barbera, F., de Carvalho, R. R., Gal, R. R., et al. 2005, ApJ, 626, L19 [Google Scholar]
- La Barbera, F., Ferreras, I., de Carvalho, R. R., et al. 2012, MNRAS, 426, 2300 [Google Scholar]
- La Barbera, F., Ferreras, I., Vazdekis, A., et al. 2013, MNRAS, 433, 3017 [Google Scholar]
- Labbé, I., van Dokkum, P., Nelson, E., et al. 2023, Nature, 616, 266 [CrossRef] [Google Scholar]
- Lagos, C. d. P., Valentino, F., Wright, R. J., et al. 2025, MNRAS, 536, 2324 [Google Scholar]
- Larsen, S. S., Ferguson, A. M. N., Howell, J. M., et al. 2025, A&A, 703, A113 [NASA ADS] [CrossRef] [EDP Sciences] [Google Scholar]
- Larson, R. B. 1974, MNRAS, 166, 585 [NASA ADS] [CrossRef] [Google Scholar]
- Le Cras, C., Maraston, C., Thomas, D., & York, D. G. 2016, MNRAS, 461, 766 [NASA ADS] [CrossRef] [Google Scholar]
- Liao, L.-W., & Cooper, A. P. 2023, MNRAS, 518, 3999 [Google Scholar]
- Lovell, C. C., Roper, W., Vijayan, A. P., et al. 2023, MNRAS, 525, 5520 [NASA ADS] [Google Scholar]
- Mancillas, B., Duc, P.-A., Combes, F., et al. 2019, A&A, 632, A122 [NASA ADS] [CrossRef] [EDP Sciences] [Google Scholar]
- Maraston, C. 2005, MNRAS, 362, 799 [NASA ADS] [CrossRef] [Google Scholar]
- Maraston, C., & Thomas, D. 2000, ApJ, 541, 126 [Google Scholar]
- Marleau, F., Cuillandre, J.-C., Cantiello, M., et al. 2025, A&A, 697, A12 [NASA ADS] [CrossRef] [EDP Sciences] [Google Scholar]
- Martig, M., Bournaud, F., Teyssier, R., & Dekel, A. 2009, ApJ, 707, 250 [Google Scholar]
- Martín-Navarro, I., La Barbera, F., Vazdekis, A., et al. 2015, MNRAS, 451, 1081 [CrossRef] [Google Scholar]
- Martín-Navarro, I., Vazdekis, A., Falcón-Barroso, J., et al. 2018, MNRAS, 475, 3700 [CrossRef] [Google Scholar]
- Martocchia, S., Boselli, A., Maraston, C., et al. 2025, A&A, 696, A79 [NASA ADS] [CrossRef] [EDP Sciences] [Google Scholar]
- Menci, N., Castellano, M., Santini, P., et al. 2022, ApJ, 938, L5 [NASA ADS] [CrossRef] [Google Scholar]
- Meusinger, H., Rudolf, C., Stecklum, B., et al. 2020, A&A, 640, A30 [NASA ADS] [CrossRef] [EDP Sciences] [Google Scholar]
- Mondelin, M., Bournaud, F., Cuillandre, J. C., et al. 2025, A&A, 699, A214 [NASA ADS] [CrossRef] [EDP Sciences] [Google Scholar]
- Morrissey, P., Conrow, T., Barlow, T. A., et al. 2007, ApJS, 173, 682 [Google Scholar]
- Nanayakkara, T., Glazebrook, K., Schreiber, C., et al. 2025, ApJ, 981, 78 [Google Scholar]
- Nersesian, A., Xilouris, E. M., Bianchi, S., et al. 2019, A&A, 624, A80 [NASA ADS] [CrossRef] [EDP Sciences] [Google Scholar]
- Noll, S., Burgarella, D., Giovannoli, E., et al. 2009, A&A, 507, 1793 [NASA ADS] [CrossRef] [EDP Sciences] [Google Scholar]
- O’Connell, R. W. 1999, ARA&A, 37, 603 [CrossRef] [Google Scholar]
- Ogando, R. L. C., Maia, M. A. G., Chiappini, C., et al. 2005, ApJ, 632, L61 [NASA ADS] [CrossRef] [Google Scholar]
- Oser, L., Ostriker, J. P., Naab, T., Johansson, P. H., & Burkert, A. 2010, ApJ, 725, 2312 [Google Scholar]
- Parikh, T., Thomas, D., Maraston, C., et al. 2019, MNRAS, 483, 3420 [Google Scholar]
- Park, S., Yang, J., Oonk, J. B. R., & Paragi, Z. 2017, MNRAS, 465, 3943 [NASA ADS] [CrossRef] [Google Scholar]
- Pasquali, A., Smith, R., Gallazzi, A., et al. 2019, MNRAS, 484, 1702 [Google Scholar]
- Pipino, A., D’Ercole, A., Chiappini, C., & Matteucci, F. 2010, MNRAS, 407, 1347 [NASA ADS] [CrossRef] [Google Scholar]
- Planck Collaboration XI. 2014, A&A, 571, A11 [NASA ADS] [CrossRef] [EDP Sciences] [Google Scholar]
- Raskutti, S., Greene, J. E., & Murphy, J. D. 2014, ApJ, 786, 23 [Google Scholar]
- Roberts, I. D., van Weeren, R. J., Timmerman, R., et al. 2022, A&A, 658, A44 [NASA ADS] [CrossRef] [EDP Sciences] [Google Scholar]
- Saglia, R., Mehrgan, K., de Nicola, S., et al. 2024, A&A, 692, A124 [NASA ADS] [CrossRef] [EDP Sciences] [Google Scholar]
- Saifollahi, T., Lançon, A., Cantiello, M., et al. 2025, A&A, 703, A184 [NASA ADS] [CrossRef] [EDP Sciences] [Google Scholar]
- Sakai, S., Kennicutt, R. C., Jr., & Moss, C. 2012, ApJS, 199, 36 [Google Scholar]
- Salpeter, E. E. 1955, ApJ, 121, 161 [Google Scholar]
- Salvador-Rusiñol, N., Ferré-Mateu, A., Vazdekis, A., & Beasley, M. A. 2022, MNRAS, 515, 4514 [CrossRef] [Google Scholar]
- Santra, S., Sanders, J. S., & Fabian, A. C. 2007, MNRAS, 382, 895 [Google Scholar]
- Serra, P., Oosterloo, T., Morganti, R., et al. 2012, MNRAS, 422, 1835 [Google Scholar]
- Simionescu, A., Allen, S. W., Mantz, A., et al. 2011, Science, 331, 1576 [Google Scholar]
- Smercina, A., Fetherolf, T., Koch, E. W., et al. 2025, arXiv e-prints [arXiv:2507.01960] [Google Scholar]
- Smith, R. J., Lucey, J. R., & Carter, D. 2012, MNRAS, 421, 2982 [Google Scholar]
- Sola, E., Duc, P.-A., Richards, F., et al. 2022, A&A, 662, A124 [NASA ADS] [CrossRef] [EDP Sciences] [Google Scholar]
- Sola, E., Duc, P.-A., Urbano, M., et al. 2025, MNRAS, 541, 3015 [Google Scholar]
- Spector, O., Finkelman, I., & Brosch, N. 2012, MNRAS, 419, 2156 [Google Scholar]
- Spiniello, C., Trager, S., Koopmans, L. V. E., & Conroy, C. 2014, MNRAS, 438, 1483 [Google Scholar]
- Spiniello, C., D’Ago, G., Coccato, L., et al. 2024, MNRAS, 527, 8793 [Google Scholar]
- Tandon, S. N., Postma, J., Joseph, P., et al. 2020, AJ, 159, 158 [Google Scholar]
- Thomas, D., Greggio, L., & Bender, R. 1999, MNRAS, 302, 537 [NASA ADS] [CrossRef] [Google Scholar]
- Thomas, D., Maraston, C., Bender, R., & Mendes de Oliveira, C. 2005, ApJ, 621, 673 [Google Scholar]
- Thomas, D., Maraston, C., Schawinski, K., Sarzi, M., & Silk, J. 2010, MNRAS, 404, 1775 [NASA ADS] [Google Scholar]
- Toni, G., Maturi, M., Castignani, G., et al. 2026, A&A, 707, A87 [NASA ADS] [CrossRef] [EDP Sciences] [Google Scholar]
- Tortora, C., Antonuccio-Delogu, V., Kaviraj, S., et al. 2009, MNRAS, 396, 61 [Google Scholar]
- Tortora, C., Napolitano, N. R., Cardone, V. F., et al. 2010, MNRAS, 407, 144 [Google Scholar]
- Tortora, C., Romanowsky, A. J., & Napolitano, N. R. 2013, ApJ, 765, 8 [NASA ADS] [CrossRef] [Google Scholar]
- Tortora, C., Tozzi, G., Agapito, G., et al. 2025, MNRAS, 540, 2555 [Google Scholar]
- Trager, S. C., Faber, S. M., Worthey, G., & González, J. J. 2000, AJ, 119, 1645 [Google Scholar]
- Tremblay, G. R., O’Dea, C. P., Baum, S. A., et al. 2015, MNRAS, 451, 3768 [Google Scholar]
- Trujillo, I., Ferré-Mateu, A., Balcells, M., Vazdekis, A., & Sánchez-Blázquez, P. 2014, ApJ, 780, L20 [Google Scholar]
- Urban, O., Werner, N., Simionescu, A., Allen, S. W., & Böhringer, H. 2011, MNRAS, 414, 2101 [NASA ADS] [CrossRef] [Google Scholar]
- Valentino, F., Brammer, G., Gould, K. M. L., et al. 2023, ApJ, 947, 20 [NASA ADS] [CrossRef] [Google Scholar]
- van Dokkum, P. G., Whitaker, K. E., Brammer, G., et al. 2010, ApJ, 709, 1018 [Google Scholar]
- van Dokkum, P., Conroy, C., Villaume, A., Brodie, J., & Romanowsky, A. J. 2017, ApJ, 841, 68 [Google Scholar]
- Vigneron, B., Hlavacek-Larrondo, J., Rhea, C. L., et al. 2024, ApJ, 962, 96 [NASA ADS] [CrossRef] [Google Scholar]
- Voyer, E. N., Boselli, A., Boissier, S., et al. 2014, A&A, 569, A124 [NASA ADS] [CrossRef] [EDP Sciences] [Google Scholar]
- Whitmore, B. C., Gilmore, D. M., & Jones, C. 1993, ApJ, 407, 489 [NASA ADS] [CrossRef] [Google Scholar]
- Worthey, G., Faber, S. M., & Gonzalez, J. J. 1992, ApJ, 398, 69 [Google Scholar]
- Yi, S. K., Lee, J., Sheen, Y.-K., et al. 2011, ApJS, 195, 22 [Google Scholar]
- Yıldırım, A., van den Bosch, R. C. E., van de Ven, G., et al. 2016, MNRAS, 456, 538 [Google Scholar]
- Yıldırım, A., van den Bosch, R. C. E., van de Ven, G., et al. 2017, MNRAS, 468, 4216 [Google Scholar]
- Young, L. M., Scott, N., Serra, P., et al. 2014, MNRAS, 444, 3408 [NASA ADS] [CrossRef] [Google Scholar]
- Zibetti, S., Gallazzi, A. R., Hirschmann, M., et al. 2020, MNRAS, 491, 3562 [Google Scholar]
Through the Mikulski Archive for Space Telescopes (MAST) portal: https://mast.stsci.edu/portal/Mashup/Clients/Mast/Portal.html
We note that we used circle regions instead of ellipses, mainly, as the emission in the FUV and NUV bands of these galaxies has a circle-projected shape.
We used the colour-magnitude transformations reported here: https://www.cadc-ccda.hia-iha.nrc-cnrc.gc.ca/en/megapipe/docs/filt.html together with the Virgo galaxy SDSS catalogue provided by Cortese et al. (2012).
A similar behaviour is also observed when employing optical colours such as g − i colours.
Calculated by interpolating the FUV, NUV and IE versus stellar mass curves at log10(M*/M⊙) = 8.7 and 9.7.
We also tried to select galaxies with a S/N < 7; however, their radial S/N turned out to be too low (< 2) for a radial analysis.
For Virgo, we use that 1″ corresponds to 80 pc (Cantiello et al. 2024).
We note that evidence for IMF variations has been found in massive elliptical galaxies, with IMFs bottom-heavier in their centre with respect to their periphery (Martín-Navarro et al. 2015; van Dokkum et al. 2017). In a follow-up study, we constrain the radial variation of the IMF in these galaxies and to extend the models to multiple IMF prescriptions, allowing for radially varying IMFs where supported by the data.
Except for WISEAJ031922_39+412545_6, for which we did not find any information on its GC system, to the best of our knowledge.
Among these, NGC 1277 is very likely a relic galaxy (Trujillo et al. 2014; Ferré-Mateu et al. 2017; Comerón et al. 2023).
Appendix A: Continuum-subtracted Hα image of NGC 1275
Figure A.1 shows the central galaxy of the Perseus cluster, NGC 1275, observed in the IE band in the left panel, while the right panel reports the continuum-subtracted Hα image. The exceptional details of the IE image reveals the presence of dust filaments located north-west of the galactic centre, as well as faint stellar structures such as tidal tails located east of the centre of NGC 1275. The continuum-subtracted Hα CFHT image, instead, reveals the well-known filaments characteristic of the cooling flows of this galaxy (e.g. Conselice et al. 2001).
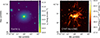 |
Fig. A.1. EuclidIE (left) and continuum-subtracted Hα (right) image of the central galaxy of Perseus, NGC 1275. |
Appendix B: Integrated UV magnitudes of Perseus galaxies within Euclid
Tables B.1, B.2, and B.3 report the estimated magnitudes from the FUV to the NIR on the galaxy sample in the Perseus ERO field of view with S/N > 3 in both FUV and NUV bands. Table B.1 reports the FUV and NUV magnitudes along with their 1σ errors in both the GALEX and UVIT sample, while Table B.2 (B.3) reports the estimated optical and NIR magnitudes in the GALEX (UVIT) sample. Table B.1 and B.2 consist of 87 rows, while Table B.3 consists of 28 rows.
FUV and NUV photometry of the integrated galaxy sample.
Optical and NIR photometry of the integrated GALEX galaxy sample.
Optical and NIR photometry of the integrated UVIT galaxy sample.
Appendix C: Comparison between GALEX and UVIT magnitudes.
The left (right) panel of Fig. C.1 reports the comparison among the FUV (NUV) magnitudes from GALEX and UVIT. We show a 1-to-1 relation as well as a linear fit. Figure C.1 shows that the FUV and NUV magnitudes from GALEX and UVIT are comparable, as the correlation coefficient r2 is > 0.95.
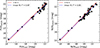 |
Fig. C.1. Comparison between the UVIT and GALEX FUV (left) and NUV (right) magnitudes for galaxies with a S/N > 3 in the FUV and NUV bands, respectively. The solid red line indicates the one-to-one relation while the dashed blue line represents a linear fit to the data. The squared Pearson correlation coefficient r2 is reported. |
Appendix D: Notes on individual galaxies
In this Appendix, we provide complementary information from the recent literature on the individual galaxies for which we performed a spatially-resolved SP analysis.
NGC 1270. Classified as an E3 galaxy by Meusinger et al. (2020), it is a compact galaxy (Reff ≃2.6 kpc, Cuillandre et al. 2025b) that has been found to be a FR by Raskutti et al. (2014). It is part of the Hobby-Eberly Massive Galaxy Survey (HEMGS), which targeted high velocity dispersion galaxies which might host “over-massive” super massive black holes (SMBH). Ferré-Mateu et al. (2015) found NGC 1270 to be an outlier in the MBH-σ relation, together with NGC 1277 and NGC 1281. Spectroscopic integral-field unit SP analysis also found a shallow gradient up to 2Reff by Greene et al. (2012).
NGC 1272. This galaxy is the second brightest and most massive ETG of the Perseus cluster. It is found to host a SMBH in its centre by Saglia et al. (2024), with a powerful radio jet (Gendron-Marsolais et al. 2021). It is kinematically classified as a slow rotator.
NGC 1277. NGC 1277 was extensively studied in the literature being the first proposed candidate as a relic galaxy, now considered the perfect example of this pristine class of galaxies (Trujillo et al. 2014). NGC 1277 is indeed compact (Reff < 2 kpc) and it is found to lack evidence of ongoing SF (Salvador-Rusiñol et al. 2022). Its SPs are very old as well as iron- and α-rich (Ferré-Mateu et al. 2017). It is found to host a single red GC population (Beasley et al. 2018) and to have no signs of tidal features by Trujillo et al. (2014), indicative of its nature untouched by mergers. Additionally, it is found to have a bottom-heavy IMF (Martín-Navarro et al. 2015) and to be dark matter deficient up to 5Reff, which has been interpreted as the reason why NGC 1277 has not accreted a halo. The lack of dark matter would inhibit dynamical friction and thus the accretion of smaller dwarf satellites (Comerón et al. 2023). Emsellem (2013) and Comerón et al. (2023) also classified it as a FR based on its stellar kinematic.
NGC 1278. NGC 1278 is an elliptical (E3) galaxy (Reff ≃5.6 kpc, Cuillandre et al. 2025b) that was kinematically studied by Comerón et al. (2023) in order to compare it to its neighbour NGC 1277 (see Fig. 3). Comerón et al. (2023) found that NGC 1278 is slow rotator and it has a bottom-lighter IMF with respect to NGC 1277. Additionally, the two galaxies differ in their dark matter content, with NGC 1278 having a non-negligible dark matter fraction.
NGC 1281. NGC 1281 is also a compact galaxy, possible relic candidate. It is a FR, according to Yıldırım et al. (2016), and lie above the MBH − σ relation, together with NGC 1277 and NGC 1270 (Ferré-Mateu et al. 2015). Additionally, Yıldırım et al. (2016) find that NGC 1281 is dark matter rich, three times higher with respect to ETGs in the ATLAS3D sample from Emsellem et al. (2011). Ferré-Mateu et al. (2015) also found solar metallicity in the centre of the galaxy which decreases to subsolar at 3Reff.
WISEAJ031922_39+412545_6. S0 compact galaxy classified as passive (no AGN) by Meusinger et al. (2020). To the best of our knowledge, we are not aware of any specific studies on this galaxy. We did not find information neither on its stellar kinematic nor on its SPs.
Appendix E: Table of adopted CIGALE parameters
Table E.1 reports on the adopted CIGALE modules and parameters used to fit the galaxies’ SEDs.
CIGALE adopted parameters and properties to fit the SEDs of the target ETGs.
Appendix F: SED fitting results of radially analysed galaxies
Figure F.1 shows the radial and integrated SED fitting results for the six galaxies in the radial sample.
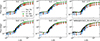 |
Fig. F.1. Radial (integrated) SEDs for the six galaxies within the radial sample. Brown squares (green triangles) represent the observed fluxes for the radial (integrated) fit, while solid blue (black) lines indicate the best-fit models for the radial (integrated) fits. |
Appendix G: SED fitting quality tests
G.1. SED fitting with no UV Upturn and contribution from young stellar populations
To test whether the UV emission could be reproduced by a young stellar component, we first checked the quality of the fit when setting TUV = 0 K (no UV upturn component), both for the integrated and the radial sample. Overall, we observe that the quality of the fit worsens compared to when upturn models are employed (Fig. G.1, left). Then, in this case where TUV = 0 K, we calculated the fraction in mass of stars younger than 2 Gyr through CIGALE. Salvador-Rusiñol et al. (2022) indeed find an anti-correlation between the stellar mass and the fraction of stars younger than 2 Gyr. We find that the two lowest-mass galaxies in the sample [log10(M*/M⊙) < 9] have fractions higher with respect to the remaining, higher-mass galaxies, however we do not have a statistically significant sample in the low-mass end to confirm this trend. Also, the fractions of young stars in galaxies with log10(M*/M⊙) > 9 is low, with a mean around 0.2% and not exceeding values of 0.3%.
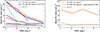 |
Fig. G.1. Left: Best-fit reduced χ2 as a function of SMA for the galaxies analysed radially. Colours are as in Fig.2. Solid (dashed) lines indicate fits performed without (with) a UV upturn component. Right: As in the left panel, but only for NGC 1272. In this case, the solid line indicates a no Upturn model with the addition of a post-starburst component in the SFH. |
Finally, for the single case of NGC 1272, we set TUV = 0 K and we try to reproduce the UV emission by modeling the SFH in CIGALE with a delayed exponential SFH in addition with a post-starburst event. We let the age of the starburst vary among 1, 10, 50, 100 Myr, with a SF timescale of 1, 5, 10, 50 Myr and a fraction in mass of 1% or 10%. We found that a post-starburst SFH is also not capable of reproducing the FUV emission in our target galaxies (right panel of Fig. G.1).
G.2. SED fitting results when the central regions are not masked
Figure G.2 shows the result of the radial SED fitting for the properties of the galaxies analysed radially, when no central masking is applied. A few changes might be visible also in the outer regions, this is due to the nature of the Monte Carlo fitting technique (see Martocchia et al. 2025). For simplicity we only show here the figure of the radial profile. However, we also re-did Figs. 7 and 8 when no central mask is applied and the results of the paper stay unchanged. The average upturn temperature is indeed ⟨TUV, rad, nomask⟩ = 25 000 ± 3100 K, while the mean SF timescale is ⟨τrad, nomask⟩ = 805 ± 274 Myr. Concerning the integrated sample, given that the masking affects only a few objects, this does not affect the final mean results. The mean upturn temperature when no mask is applied is ⟨TUV, int, nomask⟩ = 33 660 ± 8400 K, while the mean SF timescale is ⟨τint, nomask⟩ = 660 ± 380 Myr.
All Tables
Main information on the archival GALEX and AstroSat/UVIT images centred on the Perseus cluster used in this work.
All Figures
|
Fig. 1. FUV − NUV (left) and FUV − IE (right) colours as a function of stellar mass for the Perseus galaxies studied in this work and for the Virgo galaxies from the GUViCS data (Voyer et al. 2014; Boselli et al. 2014). Filled green squares (diamonds) indicate Perseus ETGs (unclassified) sources from Meusinger et al. (2020). Filled blue diamonds are Perseus LTGs, while the open red circle represents the central galaxy of Perseus, namely NGC 1275. Purple open triangles indicate Virgo LTGs, while Virgo ETGs are represented by purple open stars. M87, the central of Virgo, is also highlighted with an open red square. Black dashed lines are the magnitude limit curves for each corresponding colour for the Perseus observations. Circular apertures are defined in the FUV band starting with a radius equal to the Reff in IE by Cuillandre et al. (2025b). Apertures were adjusted when needed to fully encompass the FUV emission, and checked against the IE images to avoid contamination, as in Voyer et al. (2014). We refer to Sect. 3.1 for more details. |
| In the text | |
|
Fig. 2. FUV − NUV (left) and FUV − IE (right) colours as a function of the semi-major axis in kiloparsecs. The empty symbols indicate the values of the central colours calculated when a mask is not applied. The dotted lines connect the central unmasked regions to the successive regions. See Sect. 3.3 for more details. The Perseus ETGs are indicated with solid lines, while the Virgo ETGs from Martocchia et al. (2025) are represented by dashed lines and purple colours. The vertical dash-dotted grey line indicates the projected radius within which a disc of dust is observed in the IE images of NGC 1270, NGC 1277, NGC 1278, and NGC 1281, see Sect. 4.3. |
| In the text | |
|
Fig. 3. Images of the ETGs in the radial sample in the IE band plotted with an asinh scale. |
| In the text | |
|
Fig. 4. Top panels: IE images zoomed in the inner regions of NGC 1277, NGC 1278, and NGC 1281, from left to right. Bottom panels: Extinction maps in the IE filter, AIE, constructed from the top panels. North is up and east is to the left. |
| In the text | |
|
Fig. 5. SED fitting results of galaxy properties for the radial sample of Perseus ETGs. From the upper left to the lower right we show the mass-weighted age, stellar metallicity, temperature of the UV upturn, and SF timescale as a function of the SMA/Reff. Shaded areas represent 1σ errors. |
| In the text | |
|
Fig. 6. Mass-weighted age gradients (left) and metallicity gradients (right) as a function of galaxy stellar mass, calculated between R1/Reff = 0.1 and R2/Reff ∈ [0.3, 1.6]. Purple (green) symbols are Virgo (Perseus) galaxies. The horizontal dashed grey line indicates a flat gradient. We note that the gradient of NGC 1272 is an inner gradient, calculated up to 0.3 Reff. See text for more details. |
| In the text | |
|
Fig. 7. Temperature of the UV upturn (left), and SF timescale, τ (right), as a function of stellar mass (from Cuillandre et al. 2025b) for the integrated sample, colour-coded by the mass-weighted ages. |
| In the text | |
|
Fig. 8. Stellar mass at z = 0 as a function of the estimated stellar mass at z ≃ 5. Data are colour-coded by the fraction of assembled stellar mass by z ≃ 5. The Perseus integrated sample is connected by vertical dashed blue lines to the results of the radial analysis (cyan stars). Open upside-down blue triangles indicate the radial results on Virgo massive ETGs by Martocchia et al. (2025). The dotted red line represents assembled fractions of 100%, while the solid, dashed, and dash-dotted blue lines indicate the stellar masses found for red quiescent galaxies with JWST at z > 4.6 by Carnall et al. (2023, 2024), de Graaff et al. (2025), and Barrufet et al. (2025). Compilation from Antwi-Danso et al. (2025). |
| In the text | |
|
Fig. A.1. EuclidIE (left) and continuum-subtracted Hα (right) image of the central galaxy of Perseus, NGC 1275. |
| In the text | |
|
Fig. C.1. Comparison between the UVIT and GALEX FUV (left) and NUV (right) magnitudes for galaxies with a S/N > 3 in the FUV and NUV bands, respectively. The solid red line indicates the one-to-one relation while the dashed blue line represents a linear fit to the data. The squared Pearson correlation coefficient r2 is reported. |
| In the text | |
|
Fig. F.1. Radial (integrated) SEDs for the six galaxies within the radial sample. Brown squares (green triangles) represent the observed fluxes for the radial (integrated) fit, while solid blue (black) lines indicate the best-fit models for the radial (integrated) fits. |
| In the text | |
|
Fig. G.1. Left: Best-fit reduced χ2 as a function of SMA for the galaxies analysed radially. Colours are as in Fig.2. Solid (dashed) lines indicate fits performed without (with) a UV upturn component. Right: As in the left panel, but only for NGC 1272. In this case, the solid line indicates a no Upturn model with the addition of a post-starburst component in the SFH. |
| In the text | |
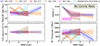 |
Fig. G.2. As in Fig. 5, but when the central regions are not masked. |
| In the text | |
Current usage metrics show cumulative count of Article Views (full-text article views including HTML views, PDF and ePub downloads, according to the available data) and Abstracts Views on Vision4Press platform.
Data correspond to usage on the plateform after 2015. The current usage metrics is available 48-96 hours after online publication and is updated daily on week days.
Initial download of the metrics may take a while.