Open Access
Fig. 4.
Download original image
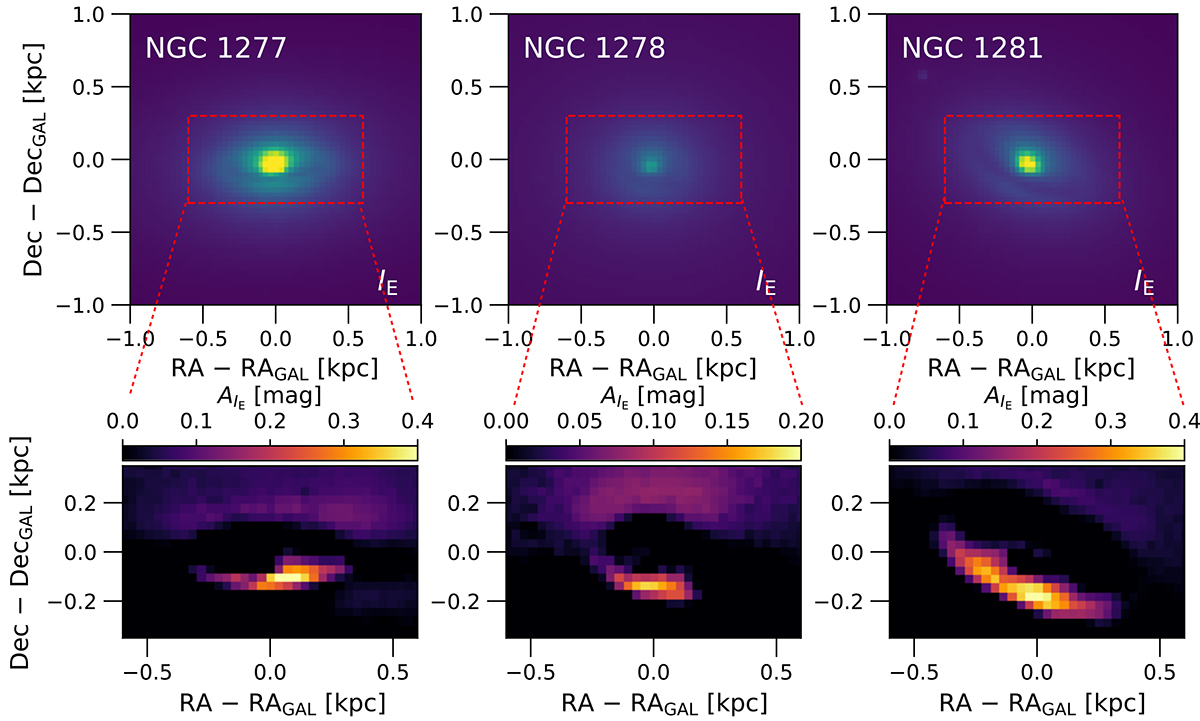
Top panels: IE images zoomed in the inner regions of NGC 1277, NGC 1278, and NGC 1281, from left to right. Bottom panels: Extinction maps in the IE filter, AIE, constructed from the top panels. North is up and east is to the left.
Current usage metrics show cumulative count of Article Views (full-text article views including HTML views, PDF and ePub downloads, according to the available data) and Abstracts Views on Vision4Press platform.
Data correspond to usage on the plateform after 2015. The current usage metrics is available 48-96 hours after online publication and is updated daily on week days.
Initial download of the metrics may take a while.