Fig. 11
Download original image
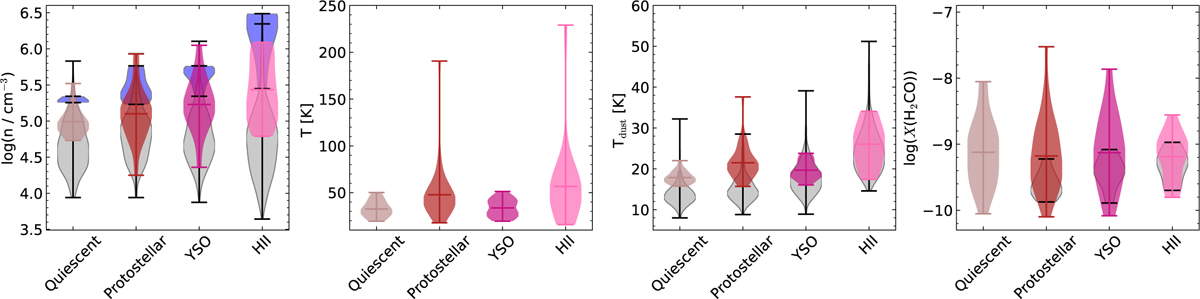
Distribution of (left to right) the H2 volume density, gas kinetic temperature, dust temperature, and H2CO fractional abundance with evolutionary phases of our sample. The horizontal lines within the distribution marks the mean of our sub-sample, gray distributions in the H2 volume density and dust temperature shows the mean of the ATLASGAL sample by Urquhart et al. (2022), and blue distribution in the H2 volume density is the ATLASGAL Top 100 sample by Giannetti et al. (2025).
Current usage metrics show cumulative count of Article Views (full-text article views including HTML views, PDF and ePub downloads, according to the available data) and Abstracts Views on Vision4Press platform.
Data correspond to usage on the plateform after 2015. The current usage metrics is available 48-96 hours after online publication and is updated daily on week days.
Initial download of the metrics may take a while.