Fig. 3
Download original image
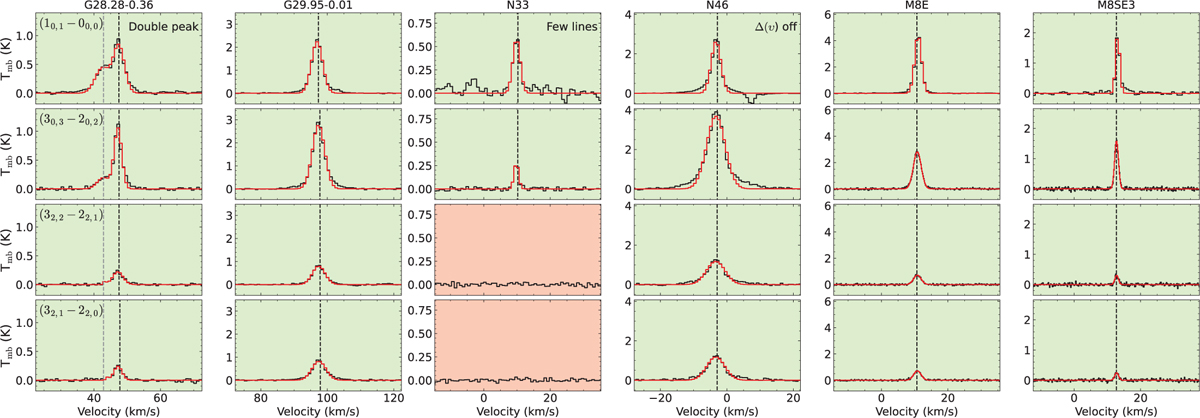
Spectra of the four H2CO transitions toward six clumps, two from each region. The background color indicates whether a line is at ≥4σ (green) or <4σ (red). The dashed black line indicates the peak velocity of the fit Gaussian for each transition. Examples of clumps with too few lines (N33), differences in ∆υ (N46), or a double peak (G28.28–0.36) are shown.
Current usage metrics show cumulative count of Article Views (full-text article views including HTML views, PDF and ePub downloads, according to the available data) and Abstracts Views on Vision4Press platform.
Data correspond to usage on the plateform after 2015. The current usage metrics is available 48-96 hours after online publication and is updated daily on week days.
Initial download of the metrics may take a while.