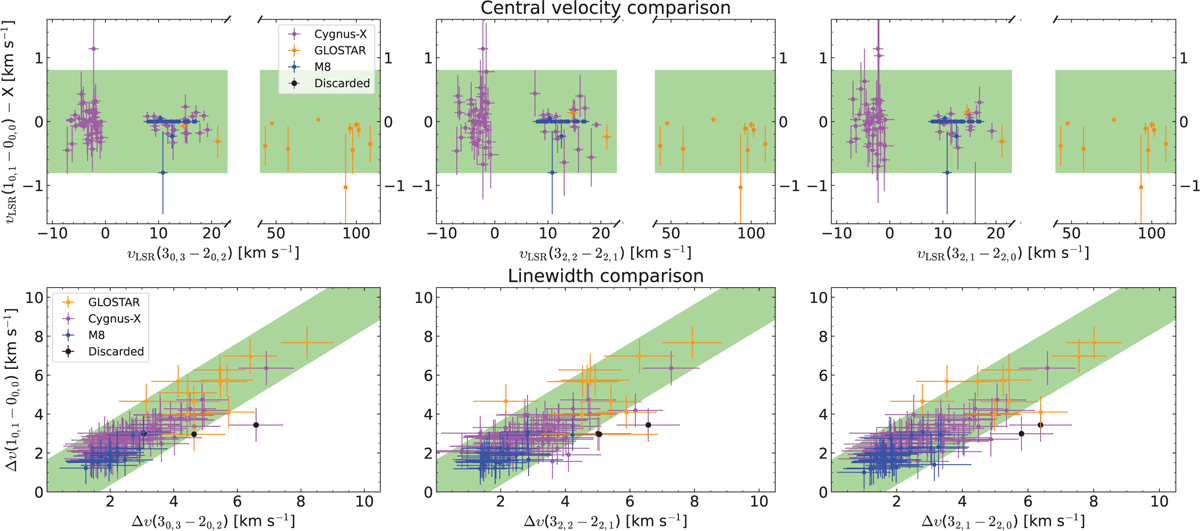
Fig. 4
Download original image
Top row: difference in υpeak between the H2CO (10,1 − 00,0) line and the three higher J-transitions of H2CO. The X (in the y-axis) denotes the υpeak noted in the x-axis. Bottom row: linewidths of the different H2CO transitions. In top and bottom rows, sources in Cygnus-X are shown in purple, GLOSTAR sources in orange, and M8 sources in blue. The black symbols indicate clumps that do not satisfy the velocity criterion (green shaded region) and were excluded from further analysis.
Current usage metrics show cumulative count of Article Views (full-text article views including HTML views, PDF and ePub downloads, according to the available data) and Abstracts Views on Vision4Press platform.
Data correspond to usage on the plateform after 2015. The current usage metrics is available 48-96 hours after online publication and is updated daily on week days.
Initial download of the metrics may take a while.