Fig. 6
Download original image
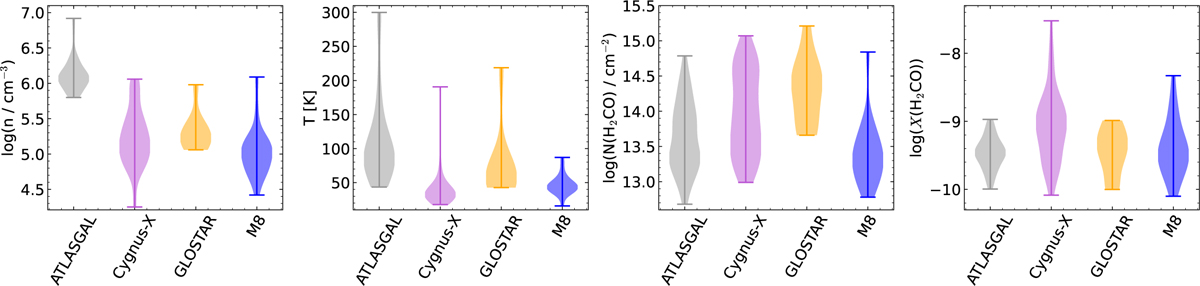
Distribution of (left to right) the H2 volume density, gas kinetic temperature, the H2CO column density, and the fractional abundance. The sources in Cygnus-X, the GLOSTAR pilot region, and M8 are shown in purple, orange, and blue across all distributions, respectively. Similar high-mass sources from the ATLASGAL Top 100, measured using higher J-transitions of H2CO by Tang et al. (2018) are depicted in gray.
Current usage metrics show cumulative count of Article Views (full-text article views including HTML views, PDF and ePub downloads, according to the available data) and Abstracts Views on Vision4Press platform.
Data correspond to usage on the plateform after 2015. The current usage metrics is available 48-96 hours after online publication and is updated daily on week days.
Initial download of the metrics may take a while.