Open Access
Fig. 8
Download original image
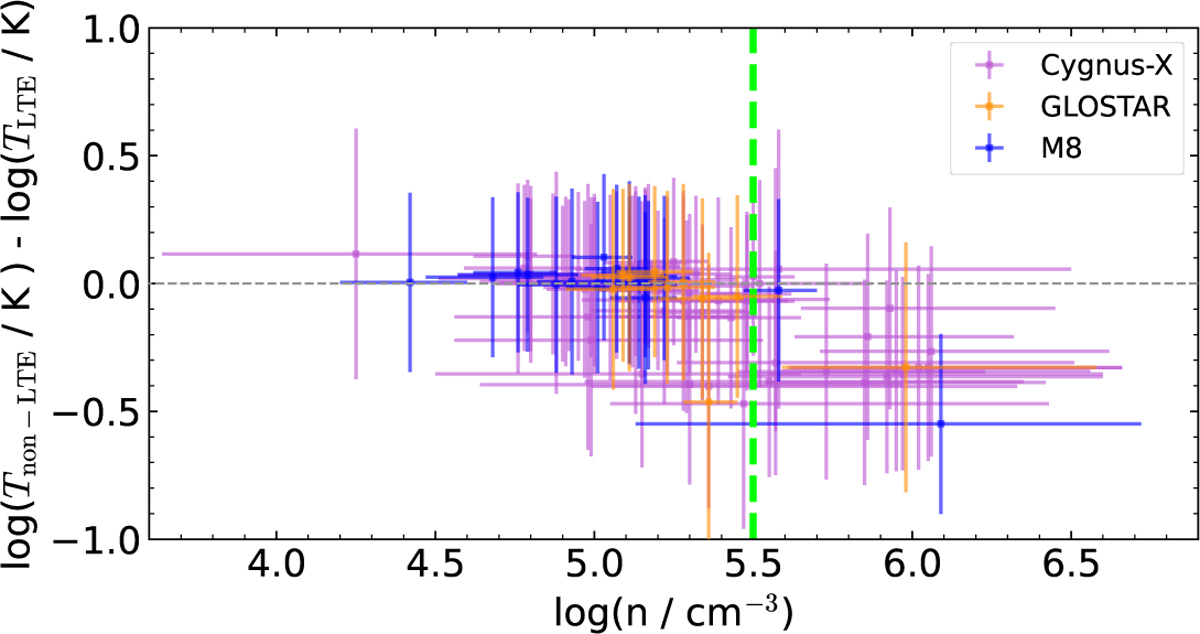
Difference between the gas kinetic temperature of sources in Cygnus-X (purple), the GLOSTAR pilot region (orange), and M8 (blue) using pyradex+emcee compared with the LTE gas kinetic temperature function presented in Tang et al. (2018). The dashed green line marks n(H2) = 105.5 cm−3.
Current usage metrics show cumulative count of Article Views (full-text article views including HTML views, PDF and ePub downloads, according to the available data) and Abstracts Views on Vision4Press platform.
Data correspond to usage on the plateform after 2015. The current usage metrics is available 48-96 hours after online publication and is updated daily on week days.
Initial download of the metrics may take a while.