Open Access
Fig. 2.
Download original image
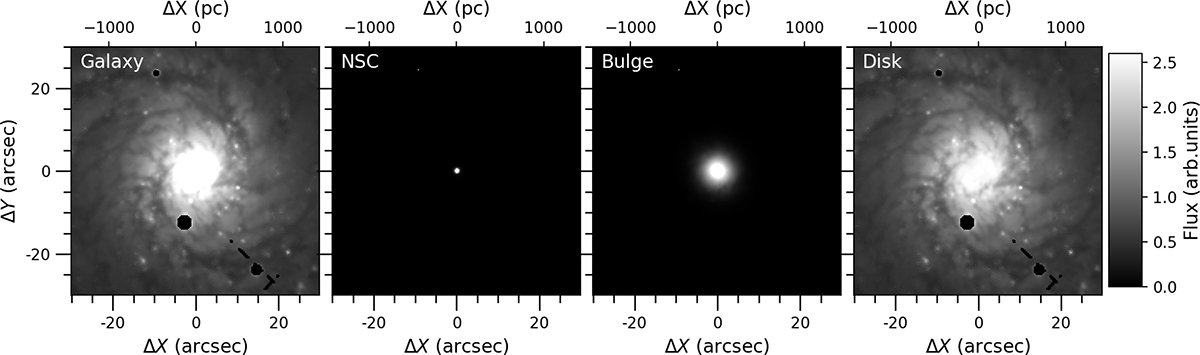
From left to right, kinematic-corrected integrated data cube (given to C2D as an input), and the data cubes of the NSC, the bulge, and the disk. These three components are from the C2D spectrophotometric decomposition. Masked regions are plotted in black.
Current usage metrics show cumulative count of Article Views (full-text article views including HTML views, PDF and ePub downloads, according to the available data) and Abstracts Views on Vision4Press platform.
Data correspond to usage on the plateform after 2015. The current usage metrics is available 48-96 hours after online publication and is updated daily on week days.
Initial download of the metrics may take a while.