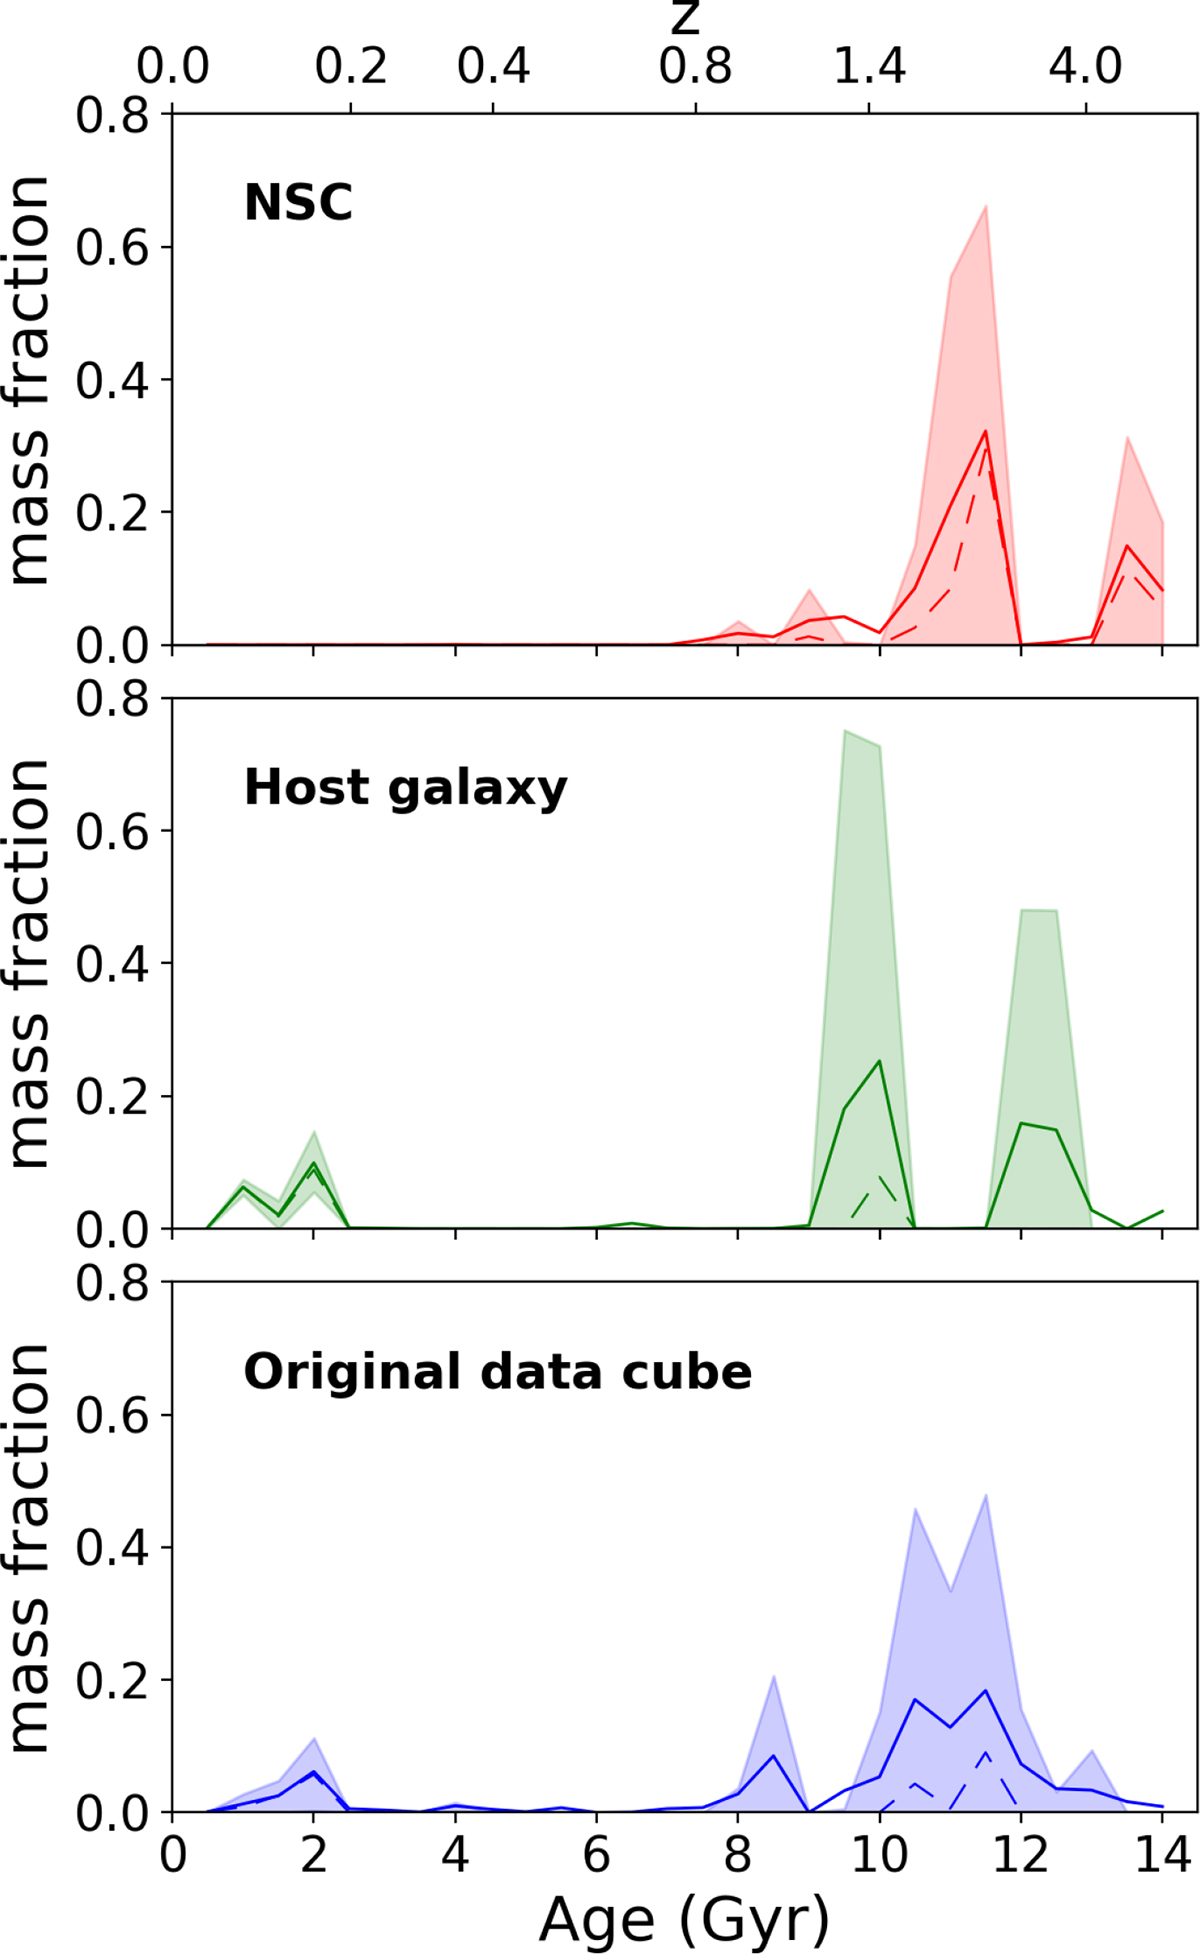
Fig. 5.
Download original image
Star formation histories of the NSC, the center of the host galaxy, and both components together (from the “original” MUSE data cube), from top to bottom. The three panels were plotted using the mass-weighted results from fitting spectra integrated in a central PSF aperture (Sect. 4.1.2 and Fig. 4). Mass fractions have been normalized to the mass of each component within the PSF aperture. The solid lines indicate the mean mass fraction for each age bin (half a billion year wide), calculated on the weight distributions from the 100 Monte Carlo realizations (Sect. 4.2). Dashed lines follow the median, and shades indicate the 16th and 84th percentiles from the distributions.
Current usage metrics show cumulative count of Article Views (full-text article views including HTML views, PDF and ePub downloads, according to the available data) and Abstracts Views on Vision4Press platform.
Data correspond to usage on the plateform after 2015. The current usage metrics is available 48-96 hours after online publication and is updated daily on week days.
Initial download of the metrics may take a while.