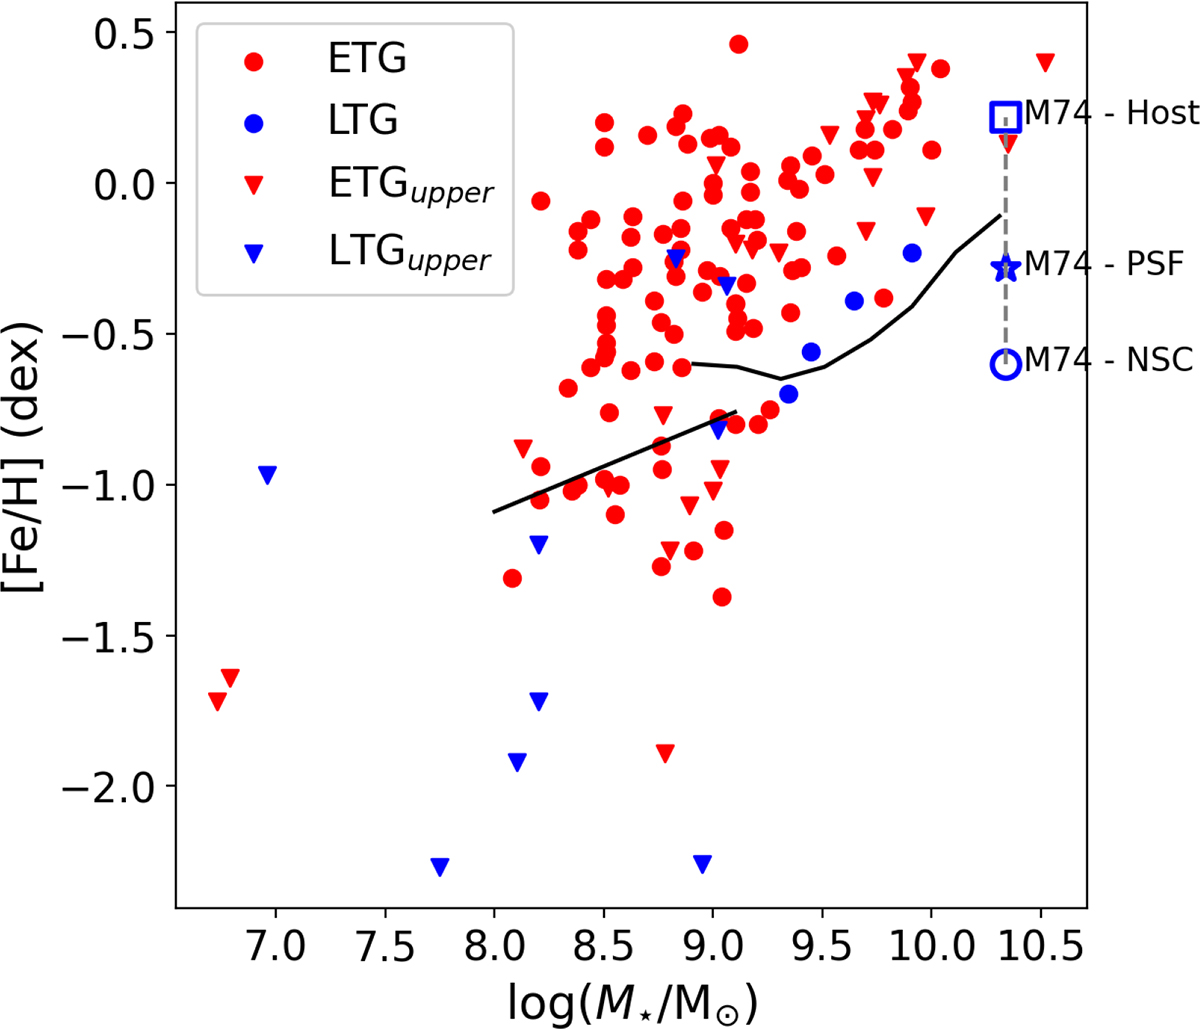
Fig. 7.
Download original image
Metallicity of the NSC as a function of the galaxy stellar mass (figure reconstructed and updated from Fig. 9 in Neumayer et al. 2020). The blue open circle indicates the [Fe/H] metallicity of the decomposed NSC of M 74. For comparison, [Fe/H] of the decomposed host galaxy is indicated with an open square, while a star indicates the [Fe/H] from the original (integrated) data cube of M 74 (see the text for all the details). The ETGs are indicated in red and LTGs in blue. Red circles are points from spectroscopic and photometric data (Koleva et al. 2009; Paudel et al. 2011; Spengler et al. 2017; Kacharov et al. 2018), as from Neumayer et al. (2020). The two solid black lines are the mass-metallicity relations of galaxies, given as reference, at the low-mass end (Kirby et al. 2013) and the high-mass end (Gallazzi et al. 2005). We have added the red triangles, which are NSC total metallicities ([M/H]) from Fahrion et al. (2021) and are therefore considered as upper limits for [Fe/H]. We have also added all the blue points. Blue triangles are for [M/H] and are thus upper limits of the NSCs in dwarf LTGs in Fahrion et al. (2022a). Blue circles are for the NSC [Fe/H] in more massive LTGs in Kacharov et al. (2018).
Current usage metrics show cumulative count of Article Views (full-text article views including HTML views, PDF and ePub downloads, according to the available data) and Abstracts Views on Vision4Press platform.
Data correspond to usage on the plateform after 2015. The current usage metrics is available 48-96 hours after online publication and is updated daily on week days.
Initial download of the metrics may take a while.